The PyQGIS Programmer's Guide by Gary Sherman
I recently read through Gary Sherman’s The PyQGIS Programmer’s Guide: Extending QGIS 3 with Python 3 (Locate Press, 2018). If you browse the documentation for PyQGIS you may find it is not particularly inviting to newcomers. I think Sherman does a great job of introducing PyQGIS to new users, although only for readers who are already familiar with GIS and QGIS.
This book doesn’t follow the ‘cookbook’ writing style with ‘recipes’ for obtaining finished products. Instead, Sherman walks through some elementary steps so that the reader has the basic knowledge (and appetite) needed for independent learning.
Sherman is the ideal guide - he is the founder of QGIS and owner of Locate Press.
Through fourteen chapters (some are quite short, and one is an introduction to Python), Sherman walks readers three different use-cases for PyQGIS:
- Running scripts: you can use PyQGIS to create convenience functions and procedures that you can run from within a QGIS project.
- Writing QGIS plugins and sharing them with the QGIS user community.
- Developing GIS desktop applications with PyQGIS and PyQt.
If you’re prepared to put in the extra work up front (Sherman’s code files will help with this) you can automate a lot of your QGIS workflow and avoid having to manually repeat tasks in QGIS (e.g., opening layers, styling layers, running processes, etc.). In my view at least, PyQGIS is most attractive in the second and third use-cases.
For those interested, I recommend reading the book. You’ll need some QGIS experience under your belt, and you might benefit more if you’re already familiar with other applications like leaflet maps (maybe through R or Python) or Shiny dashboards. Best would be some prior experience with PyQt.
I had only minimal experience with PyQGIS prior to reading the book. After reading the book I still have minimal experience - but I think the book was successful on its own terms. I’ll share a bit of the material here to provide some sense of what’s in the book. Keep in mind that this material is mostly from Chapter 14, after the reader has learned a fair amount about PyQGIS, so don’t be too alarmed if you find it intimidating.
If you speak French, you may like the new French translation by Sherman and Noureddine Farah.
Getting started
If you already have QGIS then you should have what you need to get started and follow along if you want to. The QGIS installation includes Python, PyQt, and PyQGIS. I’m working on a Linux system but you may be able to follow along on Windows.
The book was published in 2018, so it uses PyQt5 rather than the latest, PyQt6. The next QGIS release will use PyQt6, so if you decide to learn PyQGIS you may want to start there. Also, I’m going to follow the book in designing the app by writing out all the Python code but with practice you might move faster using Qt Designer.
A PyQt text editor
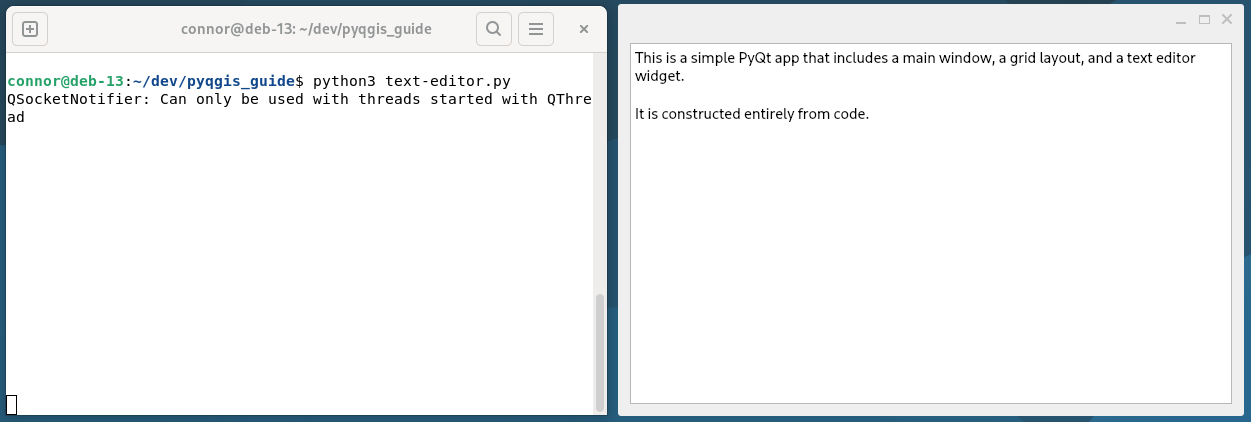
Here’s a simple app that Sherman uses to introduce PyQt. Running this code will open a new window on your screen showing the default text (“This is a simple PyQt app…”). It’s a bare text editor with no other functionality. I’ve just added a few comments to indicate what the code is doing.
## Source: Gary Sherman's The PyQGIS Programmer's Guide
from PyQt5 import QtWidgets

# initiate application
app = QtWidgets.QApplication([])

# initiate the main app window
main_win = QtWidgets.QMainWindow()

# initiate grid layout for widgets in the window
frame = QtWidgets.QFrame(main_win)
main_win.setCentralWidget(frame)
grid_layout = QtWidgets.QGridLayout(frame)

# create a text editor, with some default text in it
text_editor = QtWidgets.QTextEdit()
text_editor.setText("This is a simple PyQt app that includes "
                    "a main window, a grid layout, and a text "
                    "editor widget.\n\n"
                    "It is constructed entirely from code.")

# add the text editor to the window
grid_layout.addWidget(text_editor)

# show the window
main_win.show()

# Need the following statement if running as a script
app.exec_()
Save this code in a file called ‘text-editor.py’ then run it from your computer’s terminal:
python3 text-editor.py
Or just run the code (through main_win.show()) from inside a Python3 console.
A prototype GIS app
The most elementary GIS application is, arguably, just a map canvass. With PyQGIS we can replace our text editor widget with a map canvass widget.
Sherman’s book does a good job explaining each line of code presented. I will just introduce one PyQGIS method and then add some comments to the code again.
The Python API for QGIS is split into the following modules: gui, core, analysis, server, processing. For our prototype desktop app, we need a map canvass (that’s where the maps are displayed, allowing for interaction with the user’s mouse). This is from the qgis.gui module:
from qgis.gui import QgsMapCanvasWe’ll need the following imports from qgis.core:
from qgis.core import QgsApplication, QgsProject, QgsVectorLayerLets look a little more closely at the QgsVectorLayer class. In the PyQGIS Developer Cookbook we learn that we can “open” some vector data into our workspace using QgsVectorLayer as follows:
vlayer = QgsVectorLayer("path_to_data_layer", "optional_QGIS_layer_name", "ogr")The “path_to_data_layer” is a string that identifies a data source. The next argument, “optional_QGIS_layer_name”, is the name that will be assigned to our new layer (that is, within our QGIS project), and the third is the driver used to read the layer. We’ll use ‘ogr’ to open a layer that is stored in a GeoPackage.
Here’s an example:
# a GeoPackage layer
layer = QgsVectorLayer(
    'data/georgia.gpkg|layername=georgia',
    'georgia',
    'ogr'
    )
A GeoPackage is a kind of SQLite database that may contain any number of vector layers, so you should provide the layer name as part of the connection string. Start with the GeoPackage file location “path-to-gpkg.gpkg” and then append the layer name, as “layername=the-layers-name”; separate the two using the pipe separator like this:
gpkg_connection_string="data/georgia.gpkg|layername=counties"The PyQGIS documentation for QgsVectorLayer is more thorough than the cookbook. The docs tells us that this class “Represents a vector layer” and that it “manages a vector based dataset”. We are connecting to the data source, as distinct from loading the data into our working space.
Enough of that. Here’s our little app. We’re going to start a QGIS project (just as we started a text editor window) and then throw in a vector layer. Here’s the code for our little prototype app.
## Source: adapted from Gary Sherman's The PyQGIS Programmer's Guide
# imports from PyQt
from PyQt5.QtWidgets import QApplication, QFrame, QGridLayout, QMainWindow

# imports from PyQGIS
from qgis.gui import QgsMapCanvas
from qgis.core import QgsApplication, QgsProject, QgsVectorLayer

# initiate Qt application
app = QApplication([])

# set our (QGIS) working directory, so the app can find our data
QgsApplication.setPrefixPath(
  "/home/connor/dev/pyqgis_guide",
  True
  )

# initiate QGIS application
QgsApplication.initQgis()

# initiate main window, widget layout
main_win = QMainWindow()
frame = QFrame(main_win)
main_win.setCentralWidget(frame)
grid_layout = QGridLayout(frame)

# create map canvass
map_canvas = QgsMapCanvas()

# add the canvass to the layout
grid_layout.addWidget(map_canvas)

# connect to a vector-layer data source
layer = QgsVectorLayer(
    '/data/georgia.gpkg|layer=georgia',
    'georgia',
    'ogr'
    )

# initiate a QGIS project instance
prj = QgsProject()

# add the layer to our project
prj.addMapLayer(layer)

# show the layer in the map canvass
map_canvas.setLayers([layer])
map_canvas.zoomToFullExtent()

# show the application
main_win.show()

# Need the following statement if running as a script
app.exec_()
You can replace the ‘georgia’ layer with any vector layer you have available, just be sure that your QgsApplication.setPrefixPath points to the folder that contains your vector data.
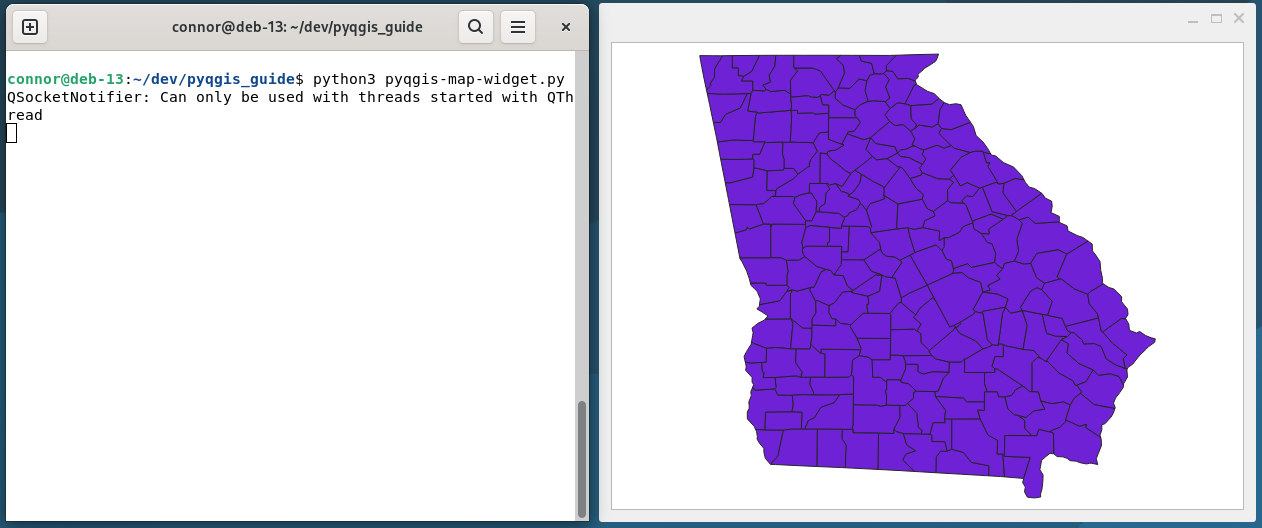
The map canvass doesn’t have all of the features one might expect - we can zoom in and out, but we can’t pan by clicking and grabbing the canvass. To learn how to activate more features see Ch. 9 Using the map canvass in the Developer’s Cookbook.
Extending the app
To experiment with what we have already, notice this addWidget method:
grid_layout.addWidget(map_canvass)
We can use .addWidget() to extend the app with new widgets.
Adding a table is an interesting extension. Think of a leaflet-style interactive map supplemented by tabular display. That’s almost useful already, we would just need to tack on a query-builder or allow point-and-click selection. If we also add in an analysis procedure that’s important for some organization then we’d have a custom desktop app.
There are multiple ways to build tabular displays in Qt. Let’s start with QTableWidget:
from PyQt5.QtWidgets import QTableWidget, QTableWidgetItem
Building from what we’ve learned and from the Qt documentation, this should augment our app with tabular display:
# Add table widget
table = QTableWidget()

# Set table parameters (N rows, N cols, colnames)
table.setRowCount(len(layer))
table.setColumnCount(len(fnames))
table.setHorizontalHeaderLabels(fnames)

# Fill table cells with layer attribute data
for i, feature in enumerate(layer.getFeatures()):
    for j, name in enumerate(fnames):
        f = str(feature[name])
        item_entry = QTableWidgetItem(f)
        table.setItem(i, j, item_entry)

# Allow sorting on columns
table.setSortingEnabled(True)

# add table widget to layout
grid_layout.addWidget(table)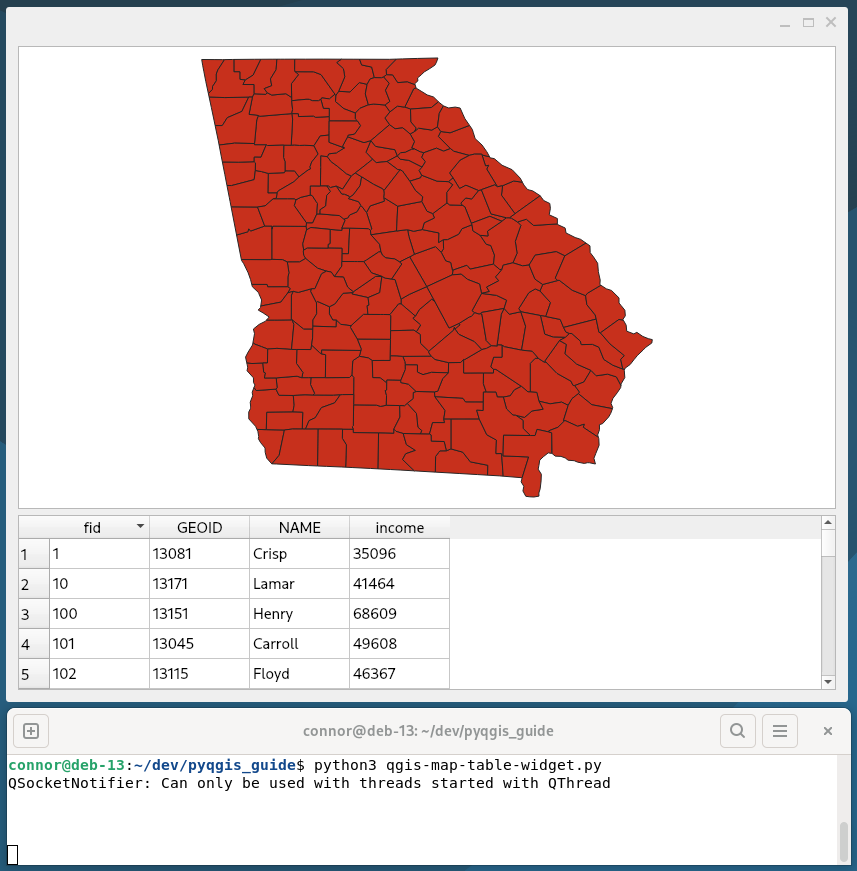
Okay, we do still have a ways to go but there’s a path forward.