Space-time modeling in Stan: charting the evolution of U.S. mortality rates
This post is a tutorial on modeling spatial-temporal data using the Stan modeling language, with a focus on areal data. When we take the right approach, Stan can provide a great platform for spatial statistics (presumably, so would other Hamiltonian Monte Carlo samplers). I’ll illustrate by modeling mortality rates for U.S. states and D.C., covering the years 1999 through 2020.
The computational methods presented here are a fairly straightforward extension of my previous work on CAR models for geostan (mainly presented in this OSF preprint) and time trend models for public health monitoring.
Disease mapping, minus the jargon
We’ll be modeling state mortality rates for the years 1999–2020, for women ages 35—44 only. The goal for this kind of ‘disease mapping’ project is to make inferences about systematic disease risk for population segments, via questions like: are mid-life mortality rates rising in Wisconsin? How fast are they rising? Is mortality higher in Ohio than Pennsylvania?
When the question pertains to massive groups of people, then raw data from a good vital statistics system can give us a suitable answer in the form of crude incidence rates. Whenever our research questions concern small or ‘smallish’ groups of people, chance exerts itself more forcefully and we may ‘see’ patterns where there are none. We usually proceed with the supposition that the data is without much error, but we distinguish conceptually between actual morbidity or mortality (crude rates) and the systematic level of risk. In other words, we assume that we know exactly what the incidence rates are but we don’t always know what to make of them.
The purpose of space-time disease mapping is to improve inferences about disease risk for a collection of population segments that are indexed by both time and geography.
In this case, we have mortality data for 50 states plus D.C. ( \( S = 51 \) ) spanning 22 years (\( T = 22 \)). This means we have a total of \(N = S \times T = 1,122 \) 'rates' about which we might like to make inferences.
The crude mortality rate is defined as
\[r_{i,t} = \frac{y_{i,t}}{p_{i,t}},\]where \( y \) is the mortality count and \( p \) is the population count. The way we improve upon the crude rate is by taking information from context. We look at rates in previous years, nearby places, and similar demographic segments.
The state-level data that we will be using here was chosen in part to keep the case study simple, rather than to illustrate all the problems of small numbers. Many of our rates are based on quite large numbers.
The statistical models
Our modeling framework takes after the hierarchical Bayesian approach developed by C. Wikle, M. Berliner, and N. Cressie (1998; after Berliner 1996). The CAR-AR model specification to be discussed here was described in that article. However, they adopted an approach similar to one described by Cliff and Ord (1981, p. 233), a kind of first-order vector autoregression that inludes time-lagged spatial neighbors. Santos-Fernandez et al. (2022) extend this to model stream network data (implemented in the SSNbayes R package, with Stan).
The CAR-AR model (defined below) was proposed again by A. Rushworth, D. Lee, and R. Mitchell (2014), who implement it in the ‘CARBayesST’ R package (our specification differs from theirs only in minor ways). They reference a similar model that was introduced by M.D. Ugarte and others (Urgarte et al. 2012). However, Ugarte et al. are working within a rather different modeling framework which as introduced by Knorr-Held (2000) and remains very popular.
I will note various advantages of the present framework after I have introduced it.
We start with the distinction between chance variation and systematic risk, per the Poisson distribution: $$y_{i,t} \sim Poisson(\mu_{i,t}).$$ This states that we expect the number of cases or deaths \( y \) at any site \( i \) and time \( t \) to fluctuate around a mean value, equal to the population size multiplied by the systematic risk: $$ \mu_{i,t} = p_{i,t} \cdot \eta_{i,t} $$ or (equivalently) $$ \mu_{i,t} = exp(log(p_{i,t}) + log(\eta_{i,t})) $$ Then the expectation of the observed rate is $$E {\Large[} \frac{y_{i,t}}{p_{i,t}} {\Large]} = \eta_{i,t}.$$ This Poisson model is our likelihood for the observed rates. The next part of the model provides a prior probability distribution for the systematic risk ('rates' or 'risk' for short).
Evolution through time
The next stage of the model is focused on inferences about the systematic risk, which we’ll work with on the log-scale:
\[\phi_{i,t} = log(\eta_{i,t}).\]Systematic levels of risk typically evolve over time (except in catastrophes, when they jump up and then hopefully down again). We can view the (unknown) rate as a movement from its own value in the previous time period, which narrows down the range of plausible values for it:
\[\phi_{i,t} = \phi_{i, t-1} + \epsilon_{i,t},\]or equivalently,
\[\phi_{i,t} \sim Normal(\phi_{i, t-1}, \tau^2).\]Estimating the scale parameter for that normal distribution gives us the characteristic amount of year-to-year variability in the rates. This is known as a random walk or first-difference model.
We will add an autoregressive (AR) coefficient to this model, rather than keep it fixed at 1 (as implied above):
\[\phi_{i,t} \sim Normal(\beta \cdot \phi_{i, t-1}, \tau^2).\]If we were to stop at this point we would have a perfectly valid model for our state incidence rates (understanding that we still need to assign some prior distributions for the parameters).
To model the evolution of mortality rates in 50 states, for example, we would simply apply this autoregressive Poisson model to each state (one model per state). We could do them all at once so that they all share the same AR coefficient; or all the AR coefficients could be fixed at 1; or each state could have its own AR coefficient. But in any case, the results may be perfectly usable for public health monitoring.
Spatial autoregression
Now let’s start over and look at the rates differently. Instead of the time series autoregression, we could improve our inferences about any given mortality rate by looking at the rates that are nearby and/or part of the same geographic region. Geographic trends are typically weaker than trends in time, so we won’t consider fixing the auto-correlation parameter at 1, as we did above.
As a starting point, a spatial autoregression for any generic, spatially-indexed vector \( x \) may be written as
\[x = \mu + \rho \cdot C (x - \mu) + \epsilon,\]where \( \rho \) is an auto-correlation parameter, \( C \) is a sparse connectivity matrix, and \( \mu \) is an intercept (we could add covariates here too). The error term \( \epsilon \) is white-noise. The expectation of \( x - \mu \) is zero, but the expected value for the \( i \)th site, given that we know the other \( n-1 \) values, is \( \mu + \rho \cdot C (x - \mu) \) (Cressie 2015, 564).
The equation states that our expectation for \( x_i \) will be informed by the overall average rate \( \mu \), by the values near to the \( i \)th location, and by the overall degree of spatial auto-correlation \( \rho \).
(There is a special type of spatial regresion that has the spatial lag of the dependent variable in its expectation, rather than spatially-lagged residuals. This material does not apply to that ‘spatial lag’ model. That model really is quite different from this, and it is not normally called for.)
A short intoduction to spatial lags
The matrix \(C\) allows us to calculate the average of neighboring values for any focal observation; we call this the (mean) spatial lag. The \( i \)th row of \( C \) contains the weights required to calculate the spatial lag \( \tilde{ x } \) for the \( i \)th value of \( x \): \( \tilde{x}_i = \sum_j^n c_{i,j} \cdot x_j\). When we pre-multiply a vector \(x\) by \( C \), we apply this spatial lag operator to each element of \( x \) to yield a vector of spatially lagged values \( \tilde{x} = C x \). In a spatial autoregressive model, the spatial lag of residuals \( C ( x - \mu ) \) is made more or less important to our expectations when it is multiplied by \( \rho \), the spatial auto-correlation (SA) parameter.
The matrix \( C \) can be constructed out of \(A\), often by row-normalizing: dividing the elements of each row by their corresponding row sum. For Alabama, \(C_{1,}\) will contain \(1/4\) just where \(A_{1,}\) contains 1.
You can find an introduction to spatial connectivity matrices here.A comparison with a more standard hierarchical model may be helpful. Remember that this part of the model is our prior distribution for the rates \( \phi \). A simple prior probability model could state that the rates (as a collection) exhibit some characteristic amount of variation \( \tau \) around their mean \( \mu \):
\[\phi_{i,t} \sim Normal( \mu, \tau^2).\]As a prior distribution, this will assign low probability to values of \( \phi_{i,t} \) that are uncharacteristically far from \( \mu \). Once we have made an inference about the values of \( \mu \) and \( \tau \), we are positioned to say just what kind of value is 'uncharacteristic'. Any crude rates that are 'uncharacteristic' will be assigned a low prior probability, as if to say 'I am skeptical that the systematic risk is as high (or low) as the crude rate alone would indicate'.
The smaller the population is, the more our inferences will be sensitive to our prior skepticism.
The main difference here, with our spatial autoregression, is that we are getting more precise by 'shrinking' our estimates towards a local mean \( \mu + \rho \cdot C (\phi - \mu) \), rather than the overall mean. Mortality rates in Mississippi, for example, may be outliers relative to the national average. But if you understand the U.S. South as a region then it is really inappropriate to impose that kind of skepticism on the rates. Similarly for Appalachia, or for any number of areas at various spatial scales. To use the standard model would be biased (in the common-sense meaning of the word).
The CAR model
There are multiple ways to translate our concept of an autoregression from the one-dimensional temporal domain into the two-dimensional spatial domain (Cliff and Ord 1981). We will adopt what is known as the conditionally-specified spatial autoregressive (CAR) model. The CAR model is a multivariate normal distribution, defined by its covariance matrix:
\(\phi \sim Normal(\mu, \Sigma)\) \(\Sigma = (I - \rho \cdot C)^{-1} M\)
Here we have:
\(I\): n-by-n identity matrix.
\(\rho\): spatial auto-correlation parameter.
\(C\): n-by-n connectivity matrix.
\(M\): n-by-n diagonal matrix containing scale parameters, \( \tau_i\ \).
The range of values that \( \rho \) can take on is limited by our requirement that \( \Sigma \) be a properly specified covariance matrix; depending on how one creates \( C \), the range may (or may not) be similar to a correlation coefficient: its maximum value may be 1 or less than 1, and its minimum permissible value often differs from \( -1 \). In the most common specification ('WCAR', used here), the maximum value is 1.
Whatever its range, in certain respects the spatial dependence parameter of the CAR model does not 'behave' similarly to Pearson's correlation coefficient. A value of 0.9 is a very strong degree of correlation, but it is a more moderate value for the auto-correlation parameter of the CAR model. (The simultaneously-specified spatial autoregressive or SAR model does have an auto-correlation parameter that seems to satisfy the intuition that we develop through the study of Pearson's correlation coefficient.)
The matrix \( M \) contains variance terms for each location. For our particular implementation of the CAR model, the variances will be sensitive to number of neighbors a site has: more neighbors means more information, thus we will have less uncertainty remaining (encoded as lower variance). When examining a site that has fewer neighbors, we gain less information by considering the neighboring values, so the uncertainty is greater.
Here we have a scalar variance parameter \( \tau \) multiplied by \( \frac{1}{w_i} \), the inverse of the number of neighbors. So the diagonal elements of matrix \( M \) are
\[m_{i,i} = \tau_i = \frac{1}{w_i} \tau.\]CARs only
Now lets return to our space-time mortality data. We are specifying an alternative to the simple vector autoregression approach that we specified earlier. We can proceed in an analogous way, though, by applying the CAR model successively at each time period. Including the likelihood, we have:
\[y_{i,t} \sim Poisson(p_{i,t} \cdot exp(\phi_{i,t}))\] \[\phi_{,t} \sim Normal( \mu, \Sigma ).\]\( \phi_{,t} \) is an \( S \)-length vector, a snapshot of mortality for all \( S \) locations at time \( t \). If desired, one can allow the parameters of the model to vary over time. The mean \( \mu \) can evolve over time, as may the auto-correlation \( \rho \) and and scale \( \tau \) parameters (yielding \(\mu_t, \rho_t, \tau_t \)).
The last part of this model is to add prior distributions. Because we are working with small rates on the log scale, something like this is not unreasonable:
\(\mu \sim Normal( -4, 4), \mu < 0\) \(\tau \sim Normal(0, 1), \tau > 0\)
The constraints on the parameters imply that those are half-normal distributions. The spatial auto-correlation parameter \( \rho \) will be assigned a uniform prior distribution across its full support (which is determined by the eigenvectors of \( C \)).
Once again, we have a simple way to proceed - fit one cross-sectional CAR model per time period - but it is nonetheless a valid space-time model which can be (and, strictly speaking, is often) applied to public health data.
The CAR-AR model
Now we have two options for modeling our rates: the time-series autoregression and the spatial autoregression. Our third approach is to combine them. We model a time trend for each location, and then we apply the CAR model to their cross-sectional errors.
Altogether, our third model is: $$ y_{i,t} \sim Poisson(p_{i,t} \cdot exp( \phi_{i,t}) ) $$ $$ \phi_{,t} \sim Normal(\beta \cdot \phi_{, t-1}, \Sigma ), t > 1 $$ $$ \phi_{,1} \sim Normal( \mu, \Sigma) $$ $$ \Sigma = (I - \rho \cdot C)^{-1} M. $$ I'll point out two advantages of this model over alternatives that happen to be more popular than this. First, the model amounts to a complex space-time auto-correlation structure, but in this framework there is no need to specify the implied (potentially massive) covariance matrix. Nor, more to the point, do we require a series of 'random effects' as in the Knorr-Held framework.
For example, our inference about one rate \( \eta_{i, t} \) will be informed directly by its own past value \( \eta_{i, t-1} \) and therefore indirectly by the past values of neighboring values.
Another advantage of this particular (CAR-AR) model is that it maintains the distinction between serial and spatial auto-correlation. The two are usually not of the same degree, with the former generally being stronger than the latter.
In other words, having both an AR parameter \( \beta \) and an SA parameter \( \rho \) is a positive feature of this model.
Another virtue is that the CAR-AR model can be reduced to either of its two component parts and still yield a reasonable model (only spatial or only time-series). (It can also be expanded with space- or time-varying parameters, though I suspect that provides more flexibility than most projects warrant.)
Also, because the CAR and AR models are proper probability models, we don't have to worry about imposing additional constraints on any parameter vectors to make them identifiable.
In short, the CAR-AR model has a number of advantages over the BYM/Knorr-Held framework.
Next we are going to take a look at the mortality data, and then we'll implement each of our three model specifications using Stan and R. ## The mortality data I accessed mortality data from the CDC Wonder database and restricted the request to females between the ages of 35 and 44. I then cleaned up the column names. I'll be using R for this. You can download the data abstract from my github page:# data is stored here
dat_path <- "https://raw.githubusercontent.com/ConnorDonegan/connordonegan.github.io/refs/heads/main/assets/2025/space-time-mortality/cdc-mortality.txt"
# read the data into R
dat <- read.table(dat_path, header = TRUE) # exported using tableHTML::tableHTML()
dat |>
head(5) |>
subset(select = c(Year, State, Deaths, Population)) |>
print()| Year | State | Deaths | Population |
|---|---|---|---|
| 1999 | Alabama | 728 | 351301 |
| 2000 | Alabama | 650 | 350582 |
| 2001 | Alabama | 713 | 346986 |
| 2002 | Alabama | 701 | 340884 |
| 2003 | Alabama | 674 | 335121 |
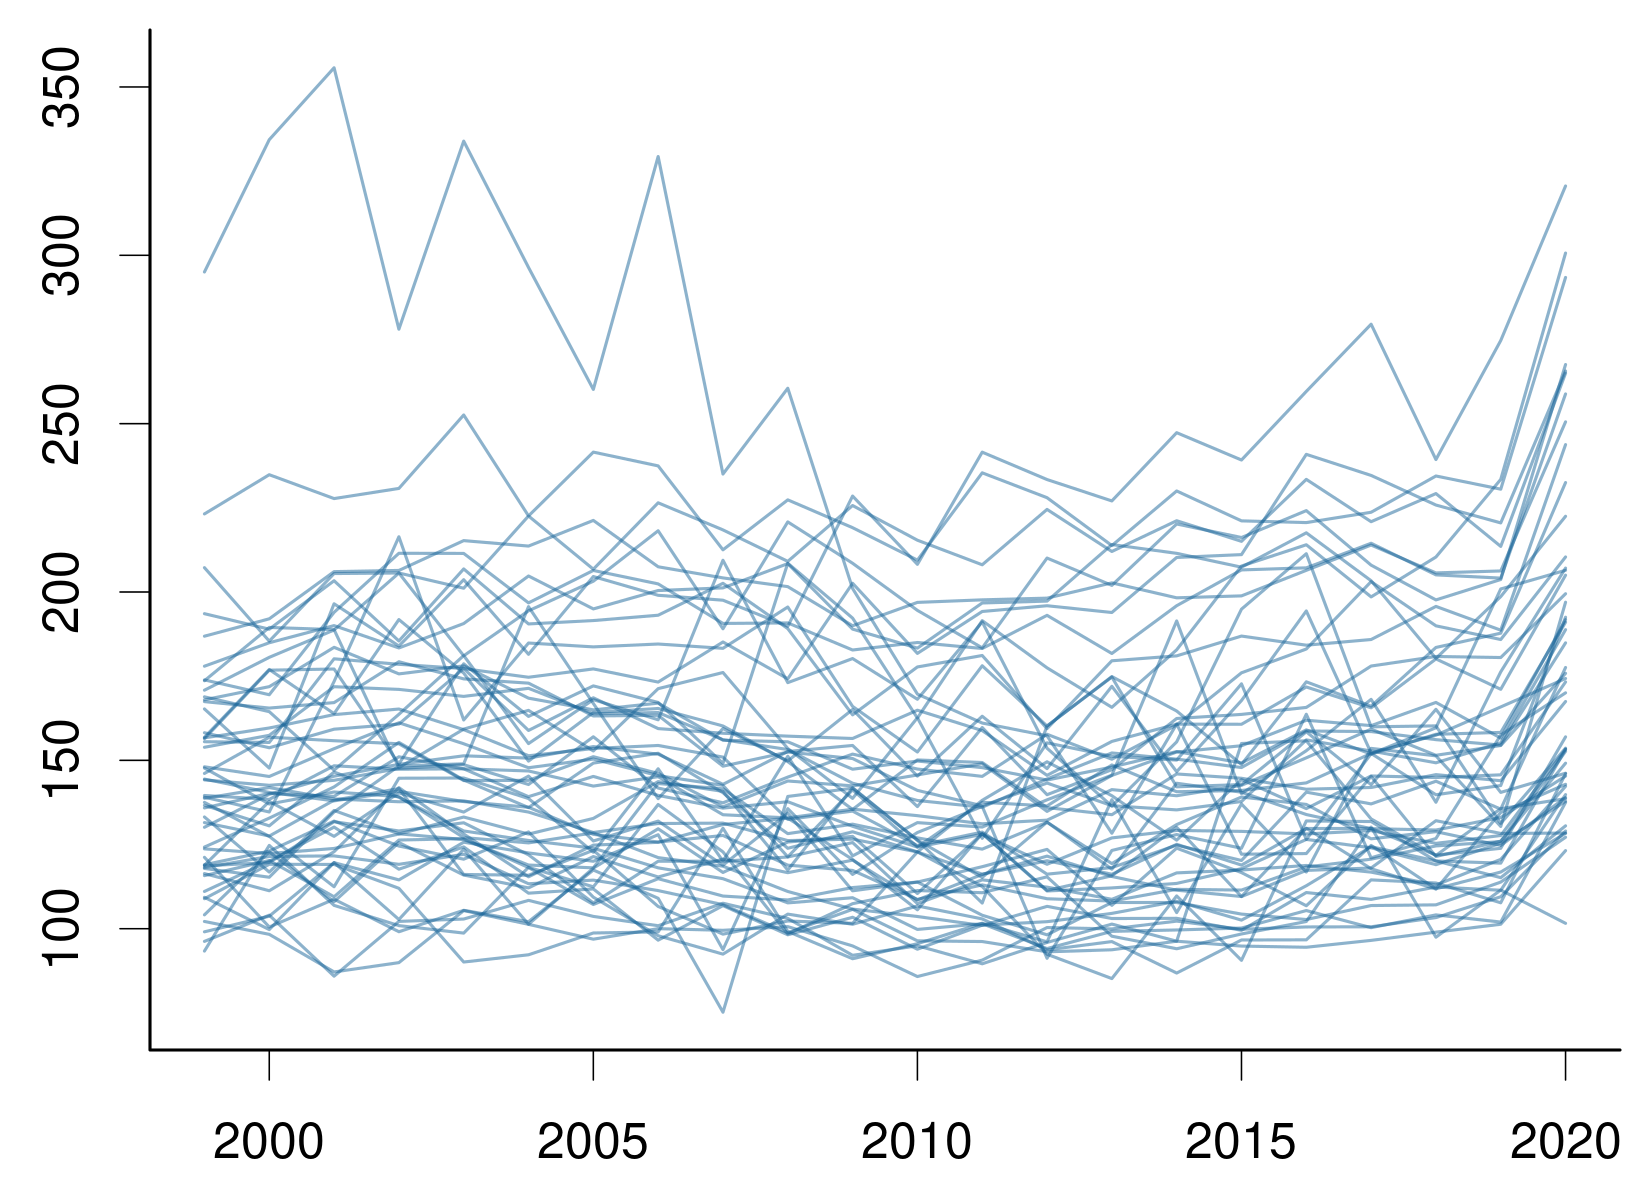
scale = 100e3
col = rgb(0.1, 0.4, 0.6, 0.5)

# set plot margins
par(mar = c(2.5 ,2.5, 0, 0))

# find y-axis limits
ylim = scale * range( dat$Deaths/dat$Population )

# make a frame for the plot
plot(x = range(dat$Year),
     y = ylim,
     t = 'n',
     bty = 'l',
     xaxt = 'n', # add axes below
     yaxt = 'n',
     xlab = NA,
     ylab = NA)
axis(1, lwd.ticks = 0.5, lwd = 0)
axis(2, lwd.ticks = 0.5, lwd = 0)

# plot crude rates by state
for (st in unique(dat$State)) {
    dst <- subset(dat, State == st)
    lines(dst$Year,
          scale * dst$Deaths/dst$Population,
          col = col)
}
We pass the observations to Stan as an \( S \times T \) array.
data {
  int S; // sites
  int TT; // time periods
  array [TT, S] int y; // outcome variable
  array[TT] vector[S] log_pop;   // offset; logdenominator in the rate 'y/pop'
}
Then we can declare our scalar parameters plus an array of rates phi \(\phi\).
parameters {
  real alpha;          // overall mean Log mortality rate
  real<lower=0> tau;   // scale of variation
  real<lower=-1, upper=1> beta_ar;  // auto-regressive coefficient
  array[TT] vector[S] phi;          // log mortality rates
}
Inside the model block, we are going to create another array, phi_mu, to store the mean of our model for the rates. For the first time period, our model for the rates \( \phi_{i,1} \) is
model {
  array[TT] vector[S] phi_mu;

  for (tt in 1:TT) {
      if (tt == 1) {
      phi_mu[1] = rep_vector(alpha, S);
      } else {
      phi_mu[tt] = beta_ar * phi[tt-1];
      }
} target += normal_lpdf(phi[tt] | phi_mu[tt], tau);
target += poisson_log_lpmf(y[tt] | log_pop[tt] + phi[tt]); target += normal_lpdf(alpha | -4, 4);
target += uniform_lpdf(beta_ar | -1, 1);
target += std_normal_lpdf(tau); generated quantities {
array[TT] vector[S] log_lik;
for (tt in 1:TT) {
for (i in 1:S) log_lik[tt, i] = poisson_log_lpmf(y[tt, i] | log_pop[tt, i] + phi[tt, i]);
}
}data {
int S; // sites
int TT; // time periods
array [TT, S] int y; // outcome variable
array[TT] vector[S] log_pop; // offset; logdenominator in the rate y/pop
}
parameters {
real alpha; // overall mean Log mortality rate
real<lower=0> tau; // scale of variation
real<lower=-1, upper=1> beta_ar; // auto-regressive coefficient
array[TT] vector[S] phi; // log mortality rates
}
model {
array[TT] vector[S] phi_mu;
for (tt in 1:TT) {
if (tt == 1) {
phi_mu[1] = rep_vector(alpha, S);
} else {
phi_mu[tt] = beta_ar * phi[tt-1];
}
      target += normal_lpdf(phi[tt] | phi_mu[tt], tau);
      target += poisson_log_lpmf(y[tt] | log_pop[tt] + phi[tt]);
}
  target += normal_lpdf(alpha | -4, 4);
  target += uniform_lpdf(beta_ar | -1, 1);
target += std_normal_lpdf(tau); // half-normal+, due to constraint on tau
}
generated quantities {
  array[TT] vector[S] log_lik;
    for (tt in 1:TT) {
      for (i in 1:S) log_lik[tt, i] = poisson_log_lpmf(y[tt, i] | log_pop[tt, i] + phi[tt, i]);
    }
}
Our mortality data is stored in the data.frame dat. Creating arrays with the proper order requires a bit of care. We will first order our data.frame by state and year, and then prepare the list of data for Stan:
# load package
library(rstan)

# order by state, year
dat <- dat[ order(dat$State, dat$Year) , ]

states <- unique(dat$State)
years <- unique(dat$Year)

S <- length(states)
TT <- length(years)

# starting the list of data
stan_dl <- list(TT = TT,
                S = S)

# array of death counts
stan_dl$y <- array(dat$Deaths, dim = c(TT, S))

# array of log-populations
pop <- array(dat$Population, dim = c(TT, S))
stan_dl$log_pop <- log( pop )
Careful using arrays in R, they are tricky
# notice: there's no warning for size mis-match; and the values fill up column-wise
x = 1:13
array(x, dim = c(3, 4)) |>
  print()
          [,1] [,2] [,3] [,4]
    [1,]    1    4    7   10
    [2,]    2    5    8   11
    [3,]    3    6    9   12
This one allows for a visual check of the order [someone made a mistake with arrays today]
# output not shown
states_array <- array(dat$State, dim = c(TT, S))
states_array[1,]
states_array[,1]
print( states_array )# path to the file containing the Stan code
mod_file <- "https://raw.githubusercontent.com/ConnorDonegan/connordonegan.github.io/refs/heads/main/assets/2025/space-time-mortality/ARs.stan"
# compile the model
ar_model <- stan_model(mod_file)
# MCMC parameters
iter = 1e3
cores = 4
# sampling
S1 <- sampling(ar_model,
data = stan_dl,
iter = iter,
cores = cores)
# print summary
print(S1, pars = c('alpha', 'beta_ar', 'tau'))
Inference for Stan model: anon_model.
4 chains, each with iter=1000; warmup=500; thin=1;
post-warmup draws per chain=500, total post-warmup draws=2000.

         mean se_mean   sd  2.5%   25%   50%   75% 97.5% n_eff Rhat
alpha   -6.55       0 0.01 -6.57 -6.56 -6.55 -6.54 -6.53  2778    1
beta_ar  1.00       0 0.00  1.00  1.00  1.00  1.00  1.00  2827    1
tau      0.07       0 0.00  0.07  0.07  0.07  0.07  0.08  1244    1

Samples were drawn using NUTS(diag_e) at Thu Feb 20 16:44:50 2025.
For each parameter, n_eff is a crude measure of effective sample size,
and Rhat is the potential scale reduction factor on split chains (at
convergence, Rhat=1).
Before moving on, we are going to grab some results for Alaska and Hawaii. We'll come back for these later.
# eta = exp(phi)
eta <- as.matrix(S1, "phi") |>
    exp()

# eta for Alaska
ak_tmp <- grep('Alaska', states)
ak_idx <- grep(paste0(',', ak_tmp, '\\]'), colnames(eta))
eta_ak <- eta[ , ak_idx ]

# eta for Hawaii
hi_tmp <- grep('Hawaii', states)
hi_idx <- grep(paste0(',', hi_tmp, '\\]'), colnames(eta))
eta_hi <- eta[ , hi_idx ]
# load spatial packages
# for CAR/Stan model help
library(geostan)
# for state boundaries, as simple features
library(tigris)
# for working with simple features
library(sf)

# coordinate reference system for cont. U.S.
us_crs = 'ESRI:102003'

# drop Alaska, Hawaii
dat_full <- dat
dat <- subset(dat_full, !grepl('Alaska|Hawaii', State))

# get state boundaries
# cb=Cartographic Boundary files (for mapping)
geo <- tigris::states(cb = TRUE)
geo <- geo |>
    st_transform(crs = us_crs) |>
    transform(State = NAME) |>
    subset(State %in% dat$State,
        select = c(State, GEOID))

# order by state, just like 'dat'
geo <- geo[ order(geo$State), ]

# verify that the order matches throughout
test_res <- numeric(length = TT)
for (tt in seq_along(years)) {
    ddt <- subset(dat, Year == years[tt])
    test_res[tt] <- all(ddt$State == geo$State)
}
stopifnot(all(test_res == 1))prep_car_data function to convert a connectivity matrix into the data required by the Stan model. So we can use that here as well:
# Create an adjacency matrix
C <- shape2mat(geo, "B", method = "rook")

# Convert C to a list of data for CAR models
car_parts <- prep_car_data(C, "WCAR")
Contiguity condition: rook
Number of neighbors per unit, summary:
   Min. 1st Qu.  Median    Mean 3rd Qu.    Max.
  1.000   3.000   4.000   4.367   6.000   8.000

Spatial weights, summary:
   Min. 1st Qu.  Median    Mean 3rd Qu.    Max.
      1       1       1       1       1       1
Range of permissible rho values: -1.392, 1
Distance-based connectivity option
This code snippet shows how to create a distance-based CAR specification. Details can be found in the OSF preprint on CAR models in Stan (Donegan 2021). For our model, the adjacency-based connectivity matrix is a better option. You can try both and compare using DIC and residual diagnostics.# A matrix of pairwise distances
D <- sf::st_distance(sf::st_centroid(dat_shp)) |>
units::set_units(km)
# Keep it sparse! You could also clip using a distance threshold, or nearest neighbor criterion
D <- C * D
# Convert D to data list for CAR models
# a proper DCAR specification: connectivity is proportional to distance
dcar_dl <- prep_car_data(D, 'DCAR', k = 1)
# creates an inverse distance matrix
# (this is done internally by prep_car_data when type='DCAR')
k <- 1
gamma <- 0
D_inv <- D
D_inv[D_inv > 0] <- (D[ D > 0] + gamma)^(-k)
# scaled by maxium value
max.dinv <- max(D_inv)
D_inv <- D_inv/max.dinv
# A different specification: row-standardized inverse-distances
# use D_inv as data input; prep_car_data (type='WCAR') will do the row-standardization
# Here, weights are Not proportional to distance: each location/node has its own scaling
# (we are hacking the popular WCAR specification)
dwcar_dl <- prep_car_data(D_inv, 'WCAR')Now we need to create our data list again (now \( S = 49 \)) and then append the the CAR parts to it:
# create data list again (now S=49)
states <- unique(dat$State)
years <- unique(dat$Year)
S <- length(states)
TT <- length(years)

stan_dl <- list(TT = TT,
                S = S)

stan_dl$y <- array(dat$Deaths, dim = c(TT, S))

pop <- array(dat$Population, dim = c(TT, S))
stan_dl$log_pop <- log( pop )

# append car_parts
stan_dl <- c(stan_dl, car_parts)stan_dl: if Moran's I values are near zero then we may have just screwed up the indexing/order.
# Moran's I index of spatial auto-correlation (SA), by year
# x = crude rates
mc_est <- numeric(length = TT)
for (tt in 1:TT) {
    y = stan_dl$y[tt,]
    den = stan_dl$log_pop[tt,] |>
        exp()
    x = y/den
    mc_est[tt] <- geostan::mc(x, car_parts$C)
}
print(mc_est)
[1] 0.371 0.302 0.329 0.449 0.335 0.367 0.456 0.372 0.385 0.376 0.453 0.433 0.370 [14] 0.456 0.416 0.412 0.366 0.379 0.391 0.424 0.344 0.387The results indicate moderately positive SA. A quick eyeball analysis suggests that the degree of SA was not changing much over time (it seems to be bouncing around 0.38, without any trend). ### CAR models in Stan It is possible to use Stan's built-in multivariate normal distribution functions to fit CAR models. But we want to take advantage of the fact that the connectivity matrix is sparse, as this allows us to use sparse matrix multiplication. We can also use some well-known tricks for calculating the log-determinant of the covariance matrix. For details, see the OSF preprint on CAR models in Stan (Donegan 2021). According to that study, these models can sample about 10 times faster than CAR models in Nimble (a popular R package for MCMC with spatial models). First, we will define a custom
_lpdf function in Stan. Second, we will update the data block of our Stan model. Third, we will update the parameters and model blocks.
Below is our custom Stan function for calculating the log-probability of the CAR model, wcar_normal_lpdf. For present purposes, just save this in a file (in your working directory) with the name car_lpdf.stan.
/**
 * Log probability density of the conditional autoregressive (CAR) model: WCAR specifications only
 *
 * @param y Process to model
 * @param mu Mean vector
 * @param tau Scale parameter
 * @param rho Spatial dependence parameter
 * @param A_w Sparse representation of the symmetric connectivity matrix, A
 * @param A_v Column indices for values in A_w
 * @param A_u Row starting indices for values in A_u
 * @param D_inv The row sums of A; i.e., the diagonal elements from the inverse of Delta, where M = Delta * tau^2 is a diagonal matrix containing the conditional variances.
 * @param log_det_D_inv Log determinant of Delta inverse.
 * @param lambda Eigenvalues of C (or of the symmetric, scaled matrix Delta^{-1/2}*C*Delta^{1/2}); for the WCAR specification, C is the row-standardized version of W.
 * @param n Length of y
 *
 * @return Log probability density of CAR prior up to additive constant
 *
 * @author Connor Donegan (connor.donegan@gmail.com), Jan 2025
 */
real wcar_normal_lpdf(vector y, vector mu,
              real tau,
              real rho,
              vector A_w,
              array[] int A_v,
              array[] int A_u,
              vector D_inv,
              real log_det_D_inv,
              vector lambda,
              int n) {
  vector[n] z = y - mu;
  real ztDz = (z .* D_inv)' * z;
  real ztAz = z' * csr_matrix_times_vector(n, n, A_w, A_v, A_u, z);
  real ldet_ImrhoC = sum(log1m(rho * lambda));
  return 0.5 * (
        -n * log( 2 * pi() )
        -2 * n * log(tau)
        + log_det_D_inv
        + ldet_ImrhoC
        - (1 / tau^2) * (ztDz - rho * ztAz));
}
A more generally applicable CAR model
The wcar_lpdf function is usually what you need. If you fit distance-based CAR models, you need a more general specification. The WCAR is generally faster than this, but this is still pretty good. This one works for any valid CAR specification (including WCAR). Again, see Donegan (2021) for details.
/**
 * Log probability density of the conditional autoregressive (CAR) model
 *
 * @param y Process to model
 * @param mu Mean vector
 * @param tau Scale parameter
 * @param rho Spatial dependence parameter
 * @param C_w Sparse representation of C
 * @param C_v Column indices for values in C
 * @param C_u Row starting indices for values in C
 * @param D_inv Diagonal elements from the inverse of Delta, where M = Delta * tau^2 is a diagonal matrix containing the conditional variances.
 * @param log_det_D_inv Log determinant of Delta inverse
 * @param lambda Eigenvalues of C (or of the symmetric, scaled matrix Delta^{-1/2}*C*Delta^{1/2}).
 * @param n Length of y
 *
 * @return Log probability density of CAR model up to additive constant
 *
 * @author Connor Donegan (connor.donegan@gmail.com), Jan 2025
*/
real car_normal_lpdf(vector y, vector mu,
		     real tau, real rho,
		     vector C_w,
		     array[] int C_v,
		     array[] int C_u,
		     vector D_inv,
		     real log_det_D_inv,
		     vector lambda,
		     int n) {
  vector[n] z = y - mu;
  vector[n] zMinv = (1 / tau^2) * z .* D_inv;
  vector[n] ImrhoCz = z - csr_matrix_times_vector(n, n, rho * C_w, C_v, C_u, z);
  real ldet_ImrhoC = sum(log1m(rho * lambda));
  return 0.5 * (
		-n * log( 2 * pi() )
		- 2 * n * log(tau)
		+ log_det_D_inv
		+ ldet_ImrhoC
		- dot_product(zMinv, ImrhoCz)
		);
} functions block at the top of the file:
functions {
#include car_lpdf.stan
} data block). Each of these items is already found in our stan_dl list, thanks to the geostan::prep_car_data function.
  // CAR parts
  int nA_w;
  vector[nA_w] A_w;
  int A_v[nA_w];
  int A_u[S + 1];
  vector[S] Delta_inv;
  real log_det_Delta_inv;
vector[S] lambda;parameters block now needs: an intercept alpha, a scale parameter tau (allow positive values only in the declaration), and an SA parameter rho. Permissible values for the SA parameter are determined by the eigenvalues lambda (we saw those printed to the R console when we used prep_car_data).
parameters {
  real alpha;
  real<lower=0> tau;
  real<lower=1/min(lambda), upper=1/max(lambda)> rho;
  array[TT] vector[S] phi;
}model block, we will use phi_mu again, but in this case phi_mu is just a constant intercept. When we loop through the time periods, we calculate the CAR model (prior distribution) and then the Poisson (likelihood). The priors on our scalar parameters are the same as previously, except we drop the AR coefficient. The prior for rho is uniform across its full support (we don't need to declare that in Stan, its the default).
(Again, we could allow alpha, tau, and rho to vary over time. In that case, we would declare them as vectors in the parameters block, then adjust the loop as needed; e.g., assign alpha[tt] to phi_mu inside the 'for' loop. My intuition is that this is all or nothing: I would not allow one parameter to vary while fixing the others. They are not independent of one another.)
model {
  vector[S] phi_mu = rep_vector(alpha, S);

  for (tt in 1:TT) {
    target += wcar_normal_lpdf(
			       phi[tt] |
			       phi_mu,
			       tau,
			       rho,
			       A_w, A_v, A_u,
			       Delta_inv,
			       log_det_Delta_inv,
			       lambda,
			       S);
     target += poisson_log_lpmf(y[tt] | log_pop[tt] + phi[tt]);
  }

  target += normal_lpdf(alpha | -4, 4);
  target += std_normal_lpdf(tau);
}
functions {
#include car_lpdf.stan
}

data {
  int S; // sites
  int TT; // time periods
  array [TT, S] int y; // outcome variable
  array[TT] vector[S] log_pop;   // offset; logdenominator in the rate y/pop

  // CAR parts
  int nA_w;
  vector[nA_w] A_w;
  int A_v[nA_w];
  int A_u[S + 1];
  vector[S] Delta_inv;
  real log_det_Delta_inv;
  vector[S] lambda;
}

parameters {
  real alpha;
  real<lower=0> tau;
  real<lower=1/min(lambda), upper=1/max(lambda)> rho;
  array[TT] vector[S] phi;
}

model {
  vector[S] phi_mu = rep_vector(alpha, S);

  for (tt in 1:TT) {
    target += wcar_normal_lpdf(
			       phi[tt] |
			       phi_mu,
			       tau,
			       rho,
			       A_w, A_v, A_u,
			       Delta_inv,
			       log_det_Delta_inv,
			       lambda,
			       S);
    target += poisson_log_lpmf(y[tt] | log_pop[tt] + phi[tt]);
  }

  target += normal_lpdf(alpha | -4, 4);
  target += std_normal_lpdf(tau);
}

generated quantities {
  array[TT] vector[S] log_lik;
    for (tt in 1:TT) {
      for (i in 1:S) log_lik[tt, i] = poisson_log_lpmf(y[tt, i] | log_pop[tt, i] + phi[tt, i]);
    }
}phi; we can examine those using print(S2). Doing so (not shown below), we find that the effective samples sizes (ESS) for the log-rates are all quite high (over 2,000 and over 3,000), and the R-hats are all 1.00.
# compile the model
mod_file = path = "https://raw.githubusercontent.com/ConnorDonegan/connordonegan.github.io/refs/heads/main/assets/2025/space-time-mortality/CARs.stan"
car_model <- stan_model(mod_file)

# Sampling.
iter = 1e3
cores = 4

S2 <- sampling(car_model,
               data = stan_dl,
               iter = iter,
               cores = cores)

# print summary of results for main parameters
print(S2, pars = c('alpha', 'rho', 'tau'))
Inference for Stan model: anon_model.
4 chains, each with iter=1000; warmup=500; thin=1;
post-warmup draws per chain=500, total post-warmup draws=2000.

       mean se_mean   sd  2.5%   25%   50%   75% 97.5% n_eff Rhat
alpha -6.52       0 0.02 -6.56 -6.54 -6.52 -6.51 -6.49  2645    1
rho    0.93       0 0.02  0.89  0.92  0.93  0.94  0.96  2319    1
tau    0.37       0 0.01  0.35  0.36  0.37  0.38  0.39  1650    1

Samples were drawn using NUTS(diag_e) at Fri Jan 10 08:07:12 2025.
For each parameter, n_eff is a crude measure of effective sample size,
and Rhat is the potential scale reduction factor on split chains (at
convergence, Rhat=1).
## The CAR-AR model in Stan
Finally, we can fit our full CAR-AR model. We don't need to make any changes to our stan_dl data list (after the CAR models). We have all the peices ready for the Stan model, too, we just need to put them together.
To create this model, I started by copying and pasting the contents of 'ARs.stan' into a new file named 'CAR_AR.stan'. Relative to 'ARs.stan', only the following changes are needed:
- Add a functions block with our #include car_lpdf.stan line.
- In the data block, make sure you add the CAR parts. You can copy and paste from CARs.stan'.
- In the parameters block, include all of our parameters: alpha, rho, tau, beta_ar, and phi.
- Finally, in the model block, we need to replace the normal_lpdf with our wcar_normal_lpdf. Again, you can copy and paste from 'CARs.stan'.
After making those changes, the 'CAR_AR.stan' file will look like this:
functions {
#include car_lpdf.stan
}

data {
  int S;
  int TT;
  array [TT, S] int y;
  array[TT] vector[S] log_pop;

  // CAR parts
  int nA_w;
  vector[nA_w] A_w;
  int A_v[nA_w];
  int A_u[S + 1];
  vector[S] Delta_inv;
  real log_det_Delta_inv;
  vector[S] lambda;
}

parameters {
  real alpha;
  real<lower=-1, upper=1> beta_ar;
  real<lower=1/min(lambda), upper=1/max(lambda)> rho;
  real<lower=0> tau;
  array[TT] vector[S] phi;
}

model {
  vector[S] phi_mu;

  for (tt in 1:TT) {
      if (tt == 1) {
        phi_mu = rep_vector(alpha, S);
      } else {
        phi_mu = beta_ar * phi[tt-1];
      }

    target += wcar_normal_lpdf(
			       phi[tt] |
			       phi_mu,
			       tau,
			       rho,
			       A_w, A_v, A_u,
			       Delta_inv,
			       log_det_Delta_inv,
			       lambda,
			       S);

      target += poisson_log_lpmf(y[tt] | log_pop[tt] + phi[tt]);
      }

  target += normal_lpdf(alpha | -4, 4);
  target += uniform_lpdf(beta_ar | -1, 1);
  target += std_normal_lpdf(tau);
}

generated quantities {
  array[TT] vector[S] log_lik;
    for (tt in 1:TT) {
      for (i in 1:S) log_lik[tt, i] = poisson_log_lpmf(y[tt, i] | log_pop[tt, i] + phi[tt, i]);
    }
}# Compile the CAR-AR model
path = "https://raw.githubusercontent.com/ConnorDonegan/connordonegan.github.io/refs/heads/main/assets/2025/space-time-mortality/CAR_AR.stan"
car_ar_model <- stan_model(path)
# MCMC settings
iter = 1e3
cores = 4
# Draw samples
S3 <- sampling(car_ar_model,
data = stan_dl,
iter = iter,
cores = cores)
# Print summary
print(S3, pars = c('alpha', 'beta_ar', 'rho', 'tau'))
Inference for Stan model: anon_model.
4 chains, each with iter=1000; warmup=500; thin=1;
post-warmup draws per chain=500, total post-warmup draws=2000.

         mean se_mean   sd  2.5%   25%   50%   75% 97.5% n_eff Rhat
alpha   -6.56       0 0.04 -6.64 -6.58 -6.56 -6.53 -6.48  3019 1.00
beta_ar  1.00       0 0.00  1.00  1.00  1.00  1.00  1.00  2035 1.00
rho      0.98       0 0.01  0.96  0.97  0.98  0.98  0.99  1731 1.00
tau      0.09       0 0.00  0.08  0.08  0.09  0.09  0.09   426 1.02

Samples were drawn using NUTS(diag_e) at Fri Jan 10 08:56:57 2025.
For each parameter, n_eff is a crude measure of effective sample size,
and Rhat is the potential scale reduction factor on split chains (at
convergence, Rhat=1).
On my laptop, sampling finished in 23 seconds. Stan issued a warning about bulk effective sample size (ESS) being low. There is a low threshold for warnings, which is good. In this case, the results are fine for analysis: the parameter with lowest ESS is tau (426), and ESS for the log-rates and log-likelihoods are all in the thousands.
I'm guessing that the warning was issued because the ESS for lp__ is only 366. The lp__ is the log-probability; I take this as an indicator for ESS that is relevant for joint probabilities, like differences between rates. So it is a fair ESS warning, although still fairly conservative.
If these results were being reported in a publication, I would run this again with more samples (iter = 2e3 or so should be fine).
There is one interesting feature of these results already. The estimate for rho is 0.98, which is actually higher than it was in the 'CARs only' model. Why? The CAR model here is applied to deviations from the state time trends (the AR residuals). My reading of this is that the mortality rates for neighboring states are more similar in their year-by-year movements than they are in their levels.
## Model comparison
For each of our three models, we collected samples for the log-likelihoods. Those are for computing information criteria. I will use the DIC for these models.
You can also use WAIC if you want to. A benefit is that the WAIC calculations can be more stable than DIC (run the same model twice and you will find the DIC may differ between runs more than WAIC.) If you check diagnostics using the loo R package, you may notice that the WAIC diagnostics are crap for your spatial models. As I understand it, that is just a feature of WAIC with autocorrelated data, and it does not necessarily indicate a problem with your model. (I used both WAIC and DIC but only report DIC for the sake of brevity.)
This code first defines an R function to calculate DIC from a Stan model (the model must contain a log_lik parameter vector), and then applies it to our three models:
DIC <- function(object, digits = 2) {
  ll <- as.matrix(object, 'log_lik')
  dev <- -2 * apply(ll, 1, FUN = sum)
  dev_bar <- mean(dev)
  penalty <- 0.5 * var(dev)
  DIC <- dev_bar + penalty
  x = round(c(DIC = DIC, penalty = penalty), digits)
  return(x)
}

rbind(
  DIC(S1),
  DIC(S2),
  DIC(S3)
) |>
  as.data.frame() |>
  transform(
    model = c('AR', 'CAR', 'CAR-AR')
  )
       DIC penalty  model
1 10536.99  804.73     AR
2 10517.93 1066.08    CAR
3 10001.27  624.69 CAR-AR
For interpretation: lower values of DIC indicate a better fit, and small differences between DICs are not to be given any weight.
The CAR-only model looks similar to the AR-only model, while the CAR-AR model has considerably lower DIC than both of the others (a difference of at least -500, including a considerably smaller penalty term). We'll use the CAR-AR model for final section.
## Visualizing mortality trends
Using the CAR-AR model results, we will first plot time trends for a selection of states. Next we'll map mortality for 2020. Finally, we'll chart percent change in mortality rates from 1999 to 2019 (stopping just before the pandemic).
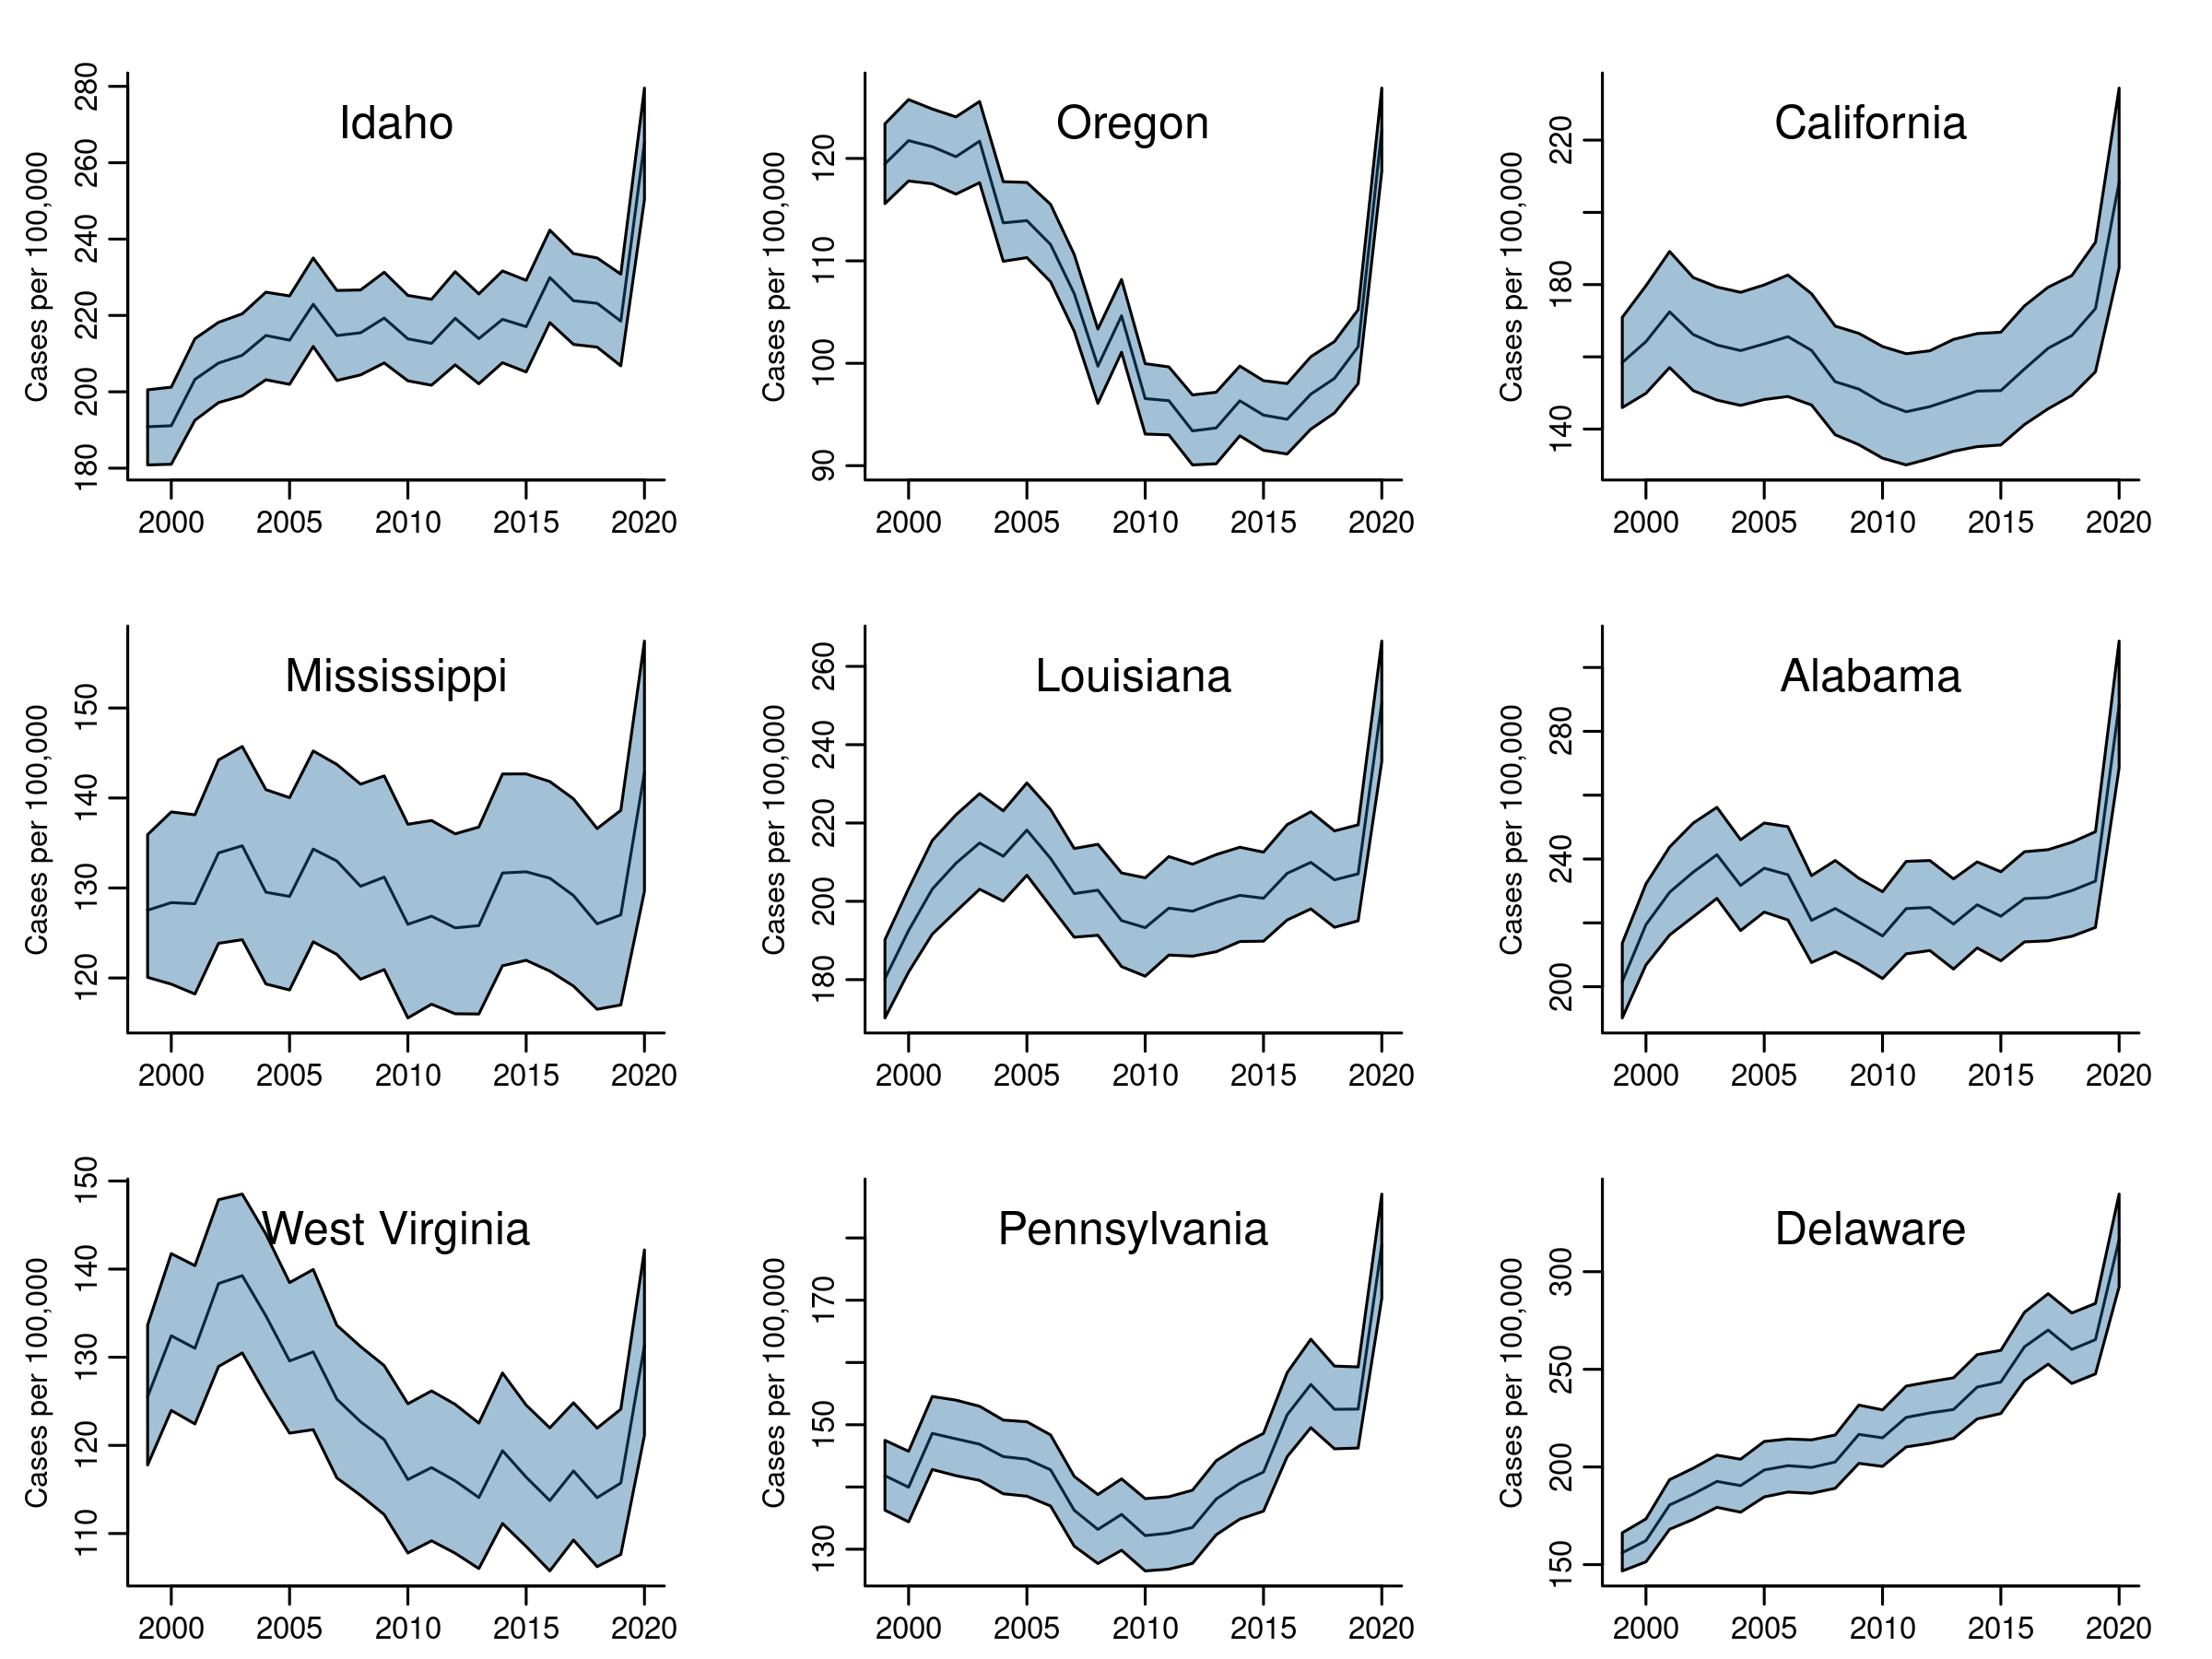
### Model-based time trends
Here we need to summarize MCMC samples by state and year. Once we extract a matrix of samples for phi (\( \phi \)), we exponentiate them to get the rates \( \eta \). Then we need to identify which columns correspond to whatever state we are interested in. The regular expressions found in the code below are introduced for that task.
eta. Each state has 22 columns in eta, one per year. Each year has 2,000 MCMC samples.
- Summarize the posterior probability distribution at each year: calculate the mean of the samples, and extreme quantiles (2.5%, 97.5%).
- Plot the mean (our estimate of the trend mortality risk) with credible intervals.
# parameters for the graphics device
par(mfrow = c(3, 3),
    mar = c(2, 3.5, 2, 2)
    )

# ordered states, for matching states to model parameters
states <- geo$State

# select a few states
selection <- c("Idaho", "Oregon", "California",
               "Mississippi", "Louisiana", "Alabama",
               "West Virginia", "Pennsylvania", "Delaware")

# rates, eta: these are indexed and named as:
#    phi[time_index, state_index]
# Exponentiate phi to get eta (do that before any other calculations)
eta <- as.matrix(S3, "phi") |>
    exp()

# find the index positions for our states: change 'Alabama' to '1', etc.
state_expr <- paste0(selection, collapse = "|")
( state_index <- grep(state_expr, states) )
[1] 1 4 7 11 17 23 36 37 47
# regular expression; we will use these to select columns of eta
( state_expr = paste0(',', state_index, ']') )
[1] ",1]" ",4]" ",7]" ",11]" ",17]" ",23]" ",36]" ",37]" ",47]"
# rates are per 100,000
scale = 100e3

# for shaded cred. intervals
col = rgb(0.1, 0.4, 0.6, 0.4)

# summary function for vector of MCMC samples
sfun <- function(x) {
    res <- c(mean = mean(x),
             lwr = quantile(x, 0.025) |>
            as.numeric(),
            upr = quantile(x, 0.975) |>
                as.numeric()
             )
    return (res)
    }

# loop over states: get their 'eta'; summarize; plot.
for (s in seq_along(selection)) {

    # match each state to its column position in eta
    index_eta_s <- grep(state_expr[s], colnames(eta))

    # dim(eta_s) is (2000, 22)
    # one row per MCMC sample; one column per year
    eta_s <- eta[ , index_eta_s ]

    df <- apply(eta_s, 2, sfun) |>
           t() |>
       	    as.data.frame()

    y <- df$mean * scale
    upr <- df$upr * scale
    lwr <- df$lwr * scale
    ylim <- range(c(upr, lwr))

    plot(
        range(years),
        ylim,
        t = 'n',
        bty = 'L',
        xlab = NA,
        ylab = NA,
        axes = TRUE,
        mgp = c(0, 0.65, 0)
    )
    lines(years, y, col = 'black')
    polygon(
        c(years, rev(years)),
        c(lwr, rev(upr)),
        col = col
    )
    mtext('Cases per 100,000', side = 2, line = 2, cex = .65)
    mtext(selection[s], side = 3, line = -2)
}
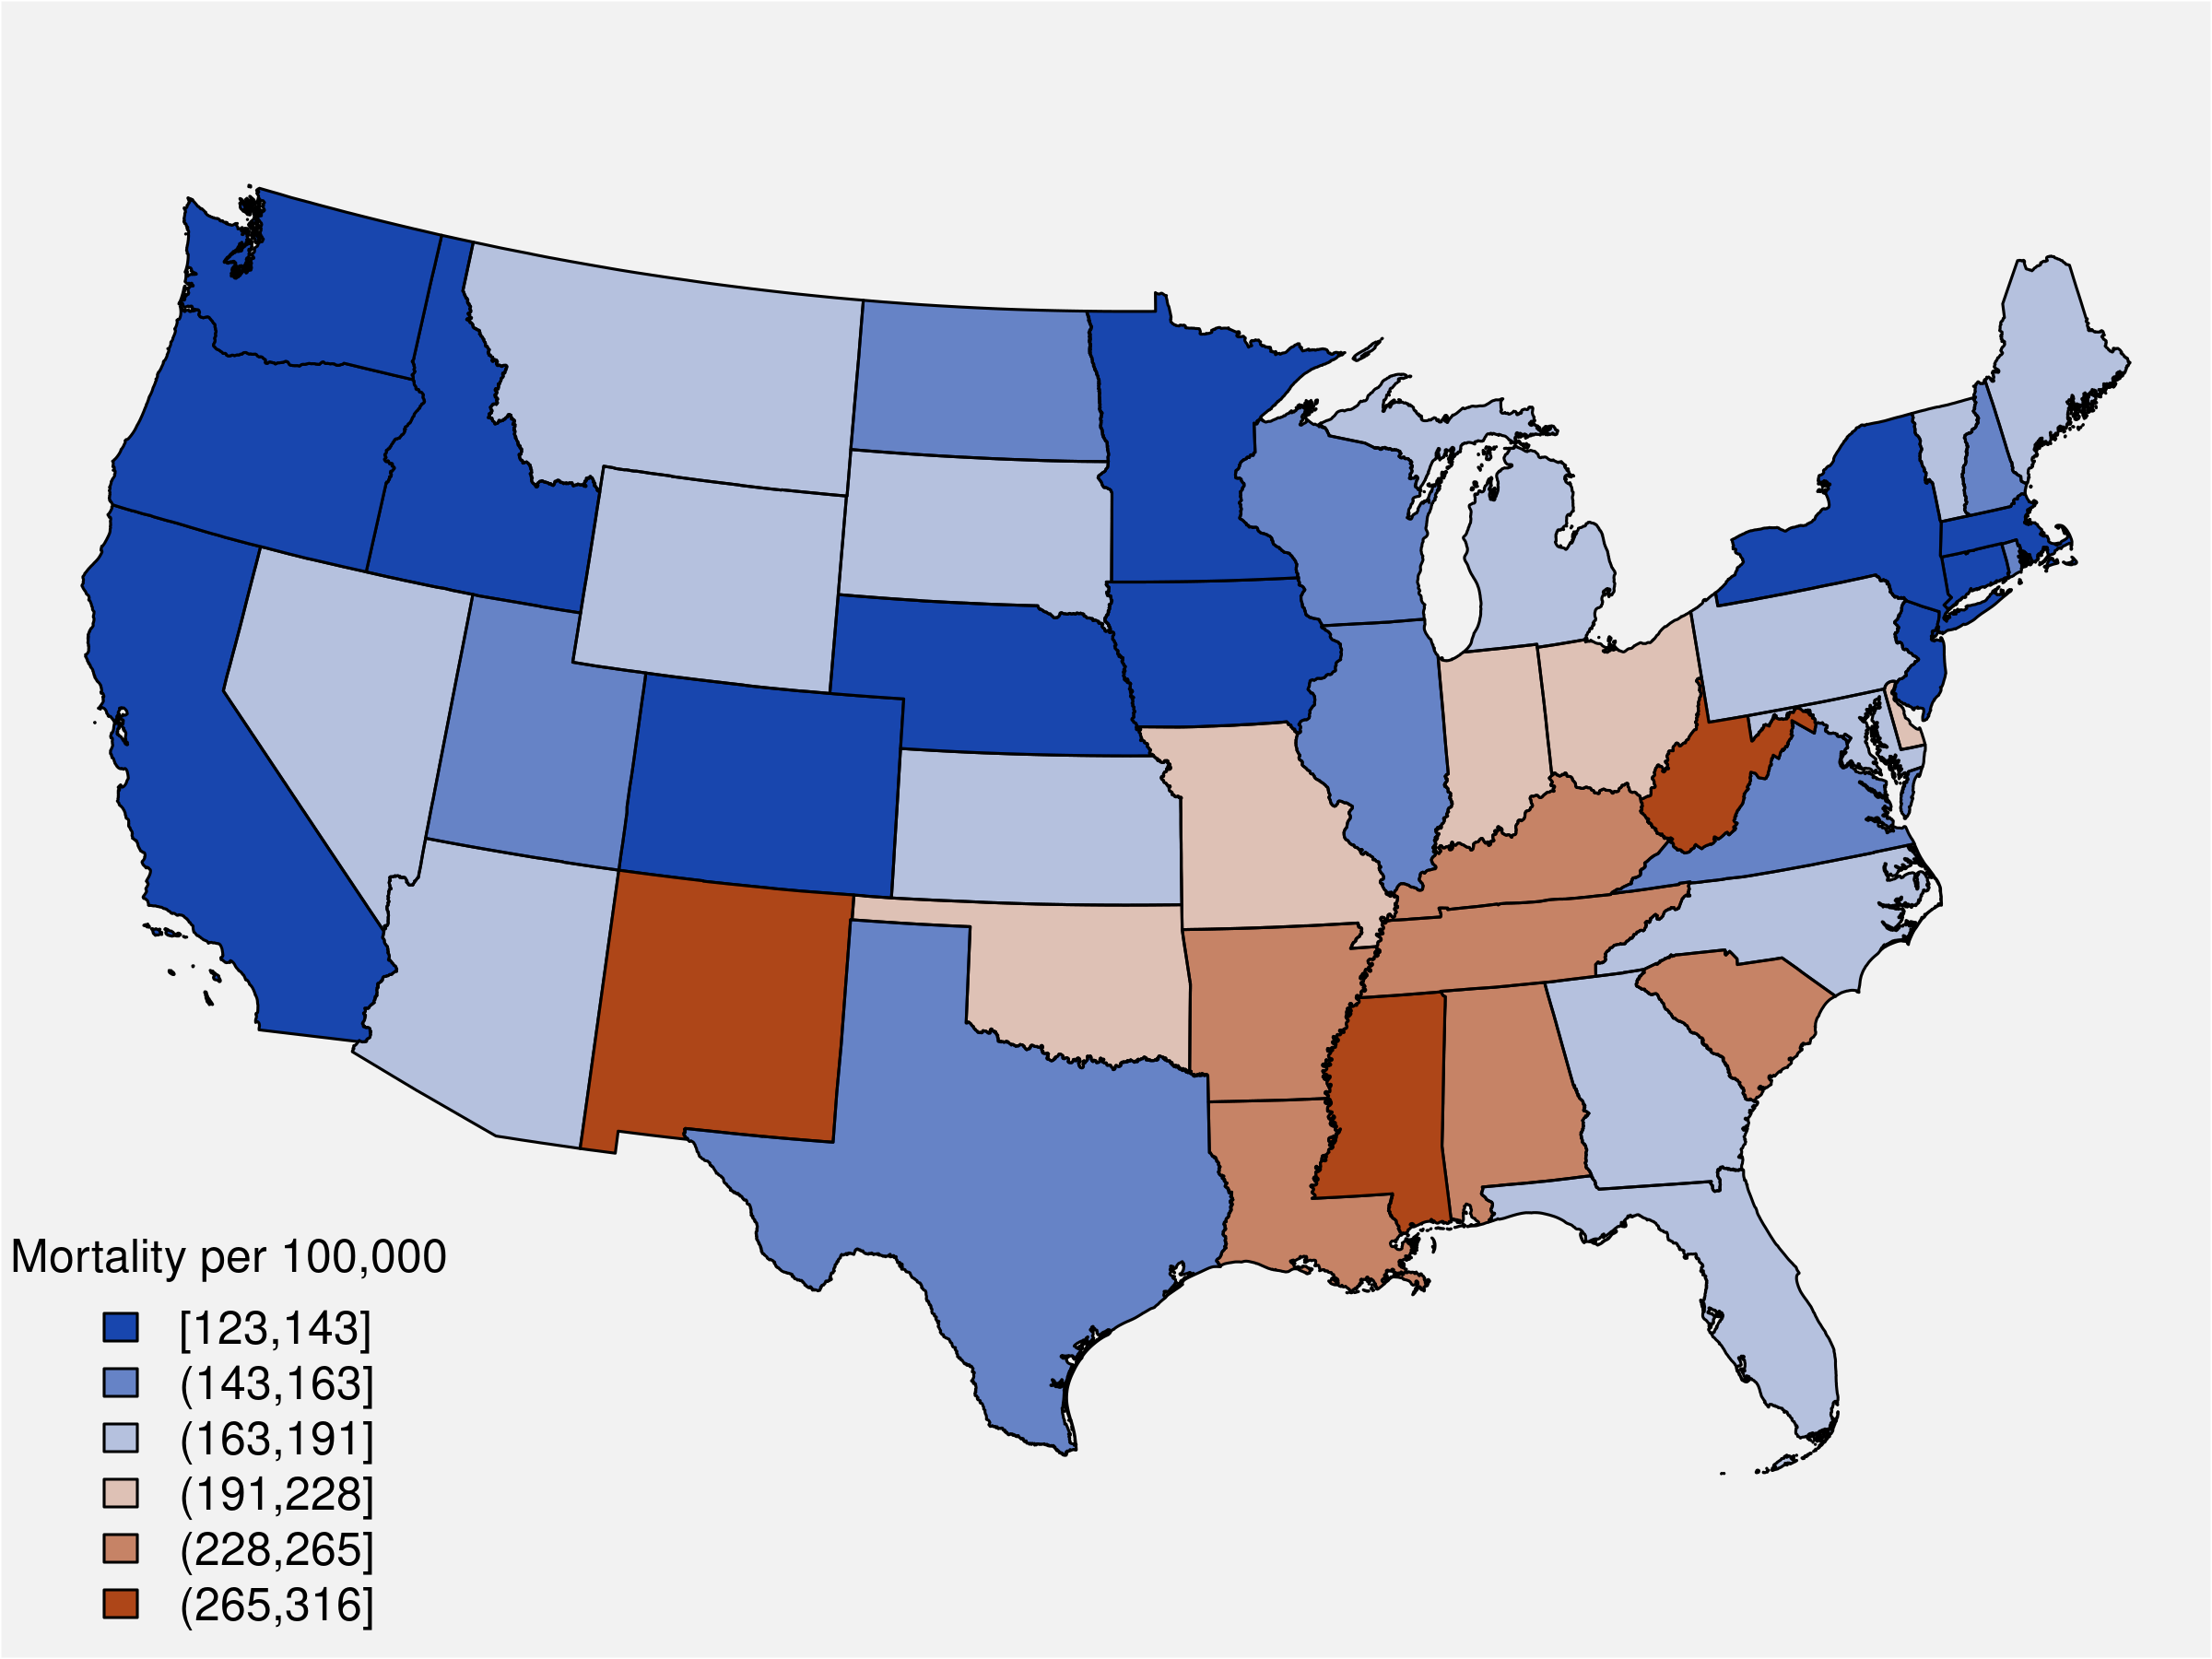
Here we map mortality rate estimates for the year 2020. We'll start again by getting our matrix samples for \( \eta \), then we extract the columns corresponding to \( t = 22 \) (year 2020).
# rates per 100,000
scale = 100e3

# MCMC samples for the rates, eta
eta <- as.matrix(S3, pars = "phi") |>
    exp()

# most recent period (t=22), 2020
t_idx <- grep('\\[22,', colnames(eta))
t_eta <- eta[ , t_idx ]
est_2020 <- apply(t_eta, 2, mean) * scale
This function takes a vector of values \( x \), break points for assigning values to cateries, and a color palette. It returns a vector with appropriate colors from the palette together with labels for our map legend. The palette is from ColorBrewer.
# for thematic mapping
map_pars <- function(x,
                     brks,
                     pal = c("#2166ac", "#67a9cf", "#d1e5f0", "#fddbc7", "#ef8a62", "#b2182b"),
                     rev = FALSE) {

    stopifnot( length(brks) == (length(pal) +1) )

    # blue=high or red=high
    if (rev) pal = rev(pal)

    # put x values into bins
    x_cut <- cut(x, breaks = brks, include.lowest = TRUE)

    # labels for each bin
    lbls <- levels( cut(x, brks, include.lowest = TRUE) )

    # colors
    rank <- as.numeric( x_cut )
    colors <- pal[ rank ]

    # return list
    ls <- list(brks = brks, lbls = lbls, pal = pal, col = colors)

  return( ls )
}classInt package to create the breaks (Bivand 2023).
library(classInt)

# create cut-points for legend categories
x_cut <- classIntervals(est_2020, n = 6, style = "jenks")

# create map data (colors, legends)
mp <- map_pars(x = t_est,
               brks = x_cut$brks)

# create map
par(mar = rep(0, 4), oma = rep(0, 4))
plot(st_geometry(geo),
     col = mp$col,
     bg = 'gray95'
     )
legend("bottomleft",
 fill = mp$pal,
 title = 'Mortality per 100,000',
 legend = mp$lbls,
 bty = 'n'
 )
This is our last analysis. We will use our matrix of MCMC samples for the rates \( \eta \) to produce samples from the posterior probability distributions for our quantities of interest, namely percent change over time. Then we will summarize those samples and put them into a figure that displays the change in mortality rates for each state plus D.C.
# MCMC samples for the rates, eta
eta <- as.matrix(S3, pars = "phi") |>
    exp()

# get years '2' and '20' (2000, 2018)
idx1 <- grep('\\[1,', colnames(eta))
idx21 <- grep('\\[21,', colnames(eta))

# grab samples by year
eta1 <- eta[ , idx1 ]
eta21 <- eta[ , idx21 ]

# MCMC samples for: d = eta21 - eta1
# dim(d_eta): c(2000, 49)
d_eta <- eta21 - eta1
d_pct <- 100 * d_eta / eta1

# summarize
df_pct <- apply(d_pct, 2, sfun) |>
    t() |>
    as.data.frame() |>
transform(State = geo$State)# don't forget Alaska
d_eta_ak <- eta_ak[ , 21] - eta_ak[ , 1]
d_pct_ak <- 100 * d_eta_ak / eta_ak[ , 1]
df_ak <- data.frame( sfun(d_pct_ak) |> t(),
State = 'Alaska')
# and Hawaii
d_eta_hi <- eta_hi[ , 21] - eta_hi[ , 1]
d_pct_hi <- 100 * d_eta_hi / eta_hi[ , 1]
df_hi <- data.frame( sfun(d_pct_hi) |> t(),
State = 'Hawaii')
# combine with the others
df_pct <- df_pct |>
rbind(df_ak) |>
rbind(df_hi)df_pct <- df_pct[ order(df_pct$mean) , ]
labels = paste0(
51:1,
'. ',
df_pct$State,
': ',
round( df_pct$mean ),
' [',
round( df_pct$lwr ),
', ',
round( df_pct$upr ),
']'
)
png("assets/2025/space-time-mortality/model-chart-pct-change.png",
width = 7,
height = 11,
units = 'in',
res = 350)
par(mar = c(4, 14, 2, 2),
bg = 'gray90')
xlim <- range(c(df_pct$lwr, df_pct$upr))
plot(
df_pct$mean,
1:51,
t = 'p',
pch = 18,
bty = 'L',
xlim = xlim,
xlab = NA,
ylab = NA,
axes = FALSE
)
abline(v = 0, lty = 3)
segments(
x0 = df_pct$lwr,
x1 = df_pct$upr,
y0 = 1:51)
axis(1, mgp = c(0, 0.65, 0))
axis(2,
at = 1:51,
cex.axis = 0.85,
labels = labels,
lwd = 0,
lwd.ticks = 0,
las = 1)
mtext('Percent change in mortality, 1999 to 2019: women ages 35-44', side = 1, line = 2)
dev.off()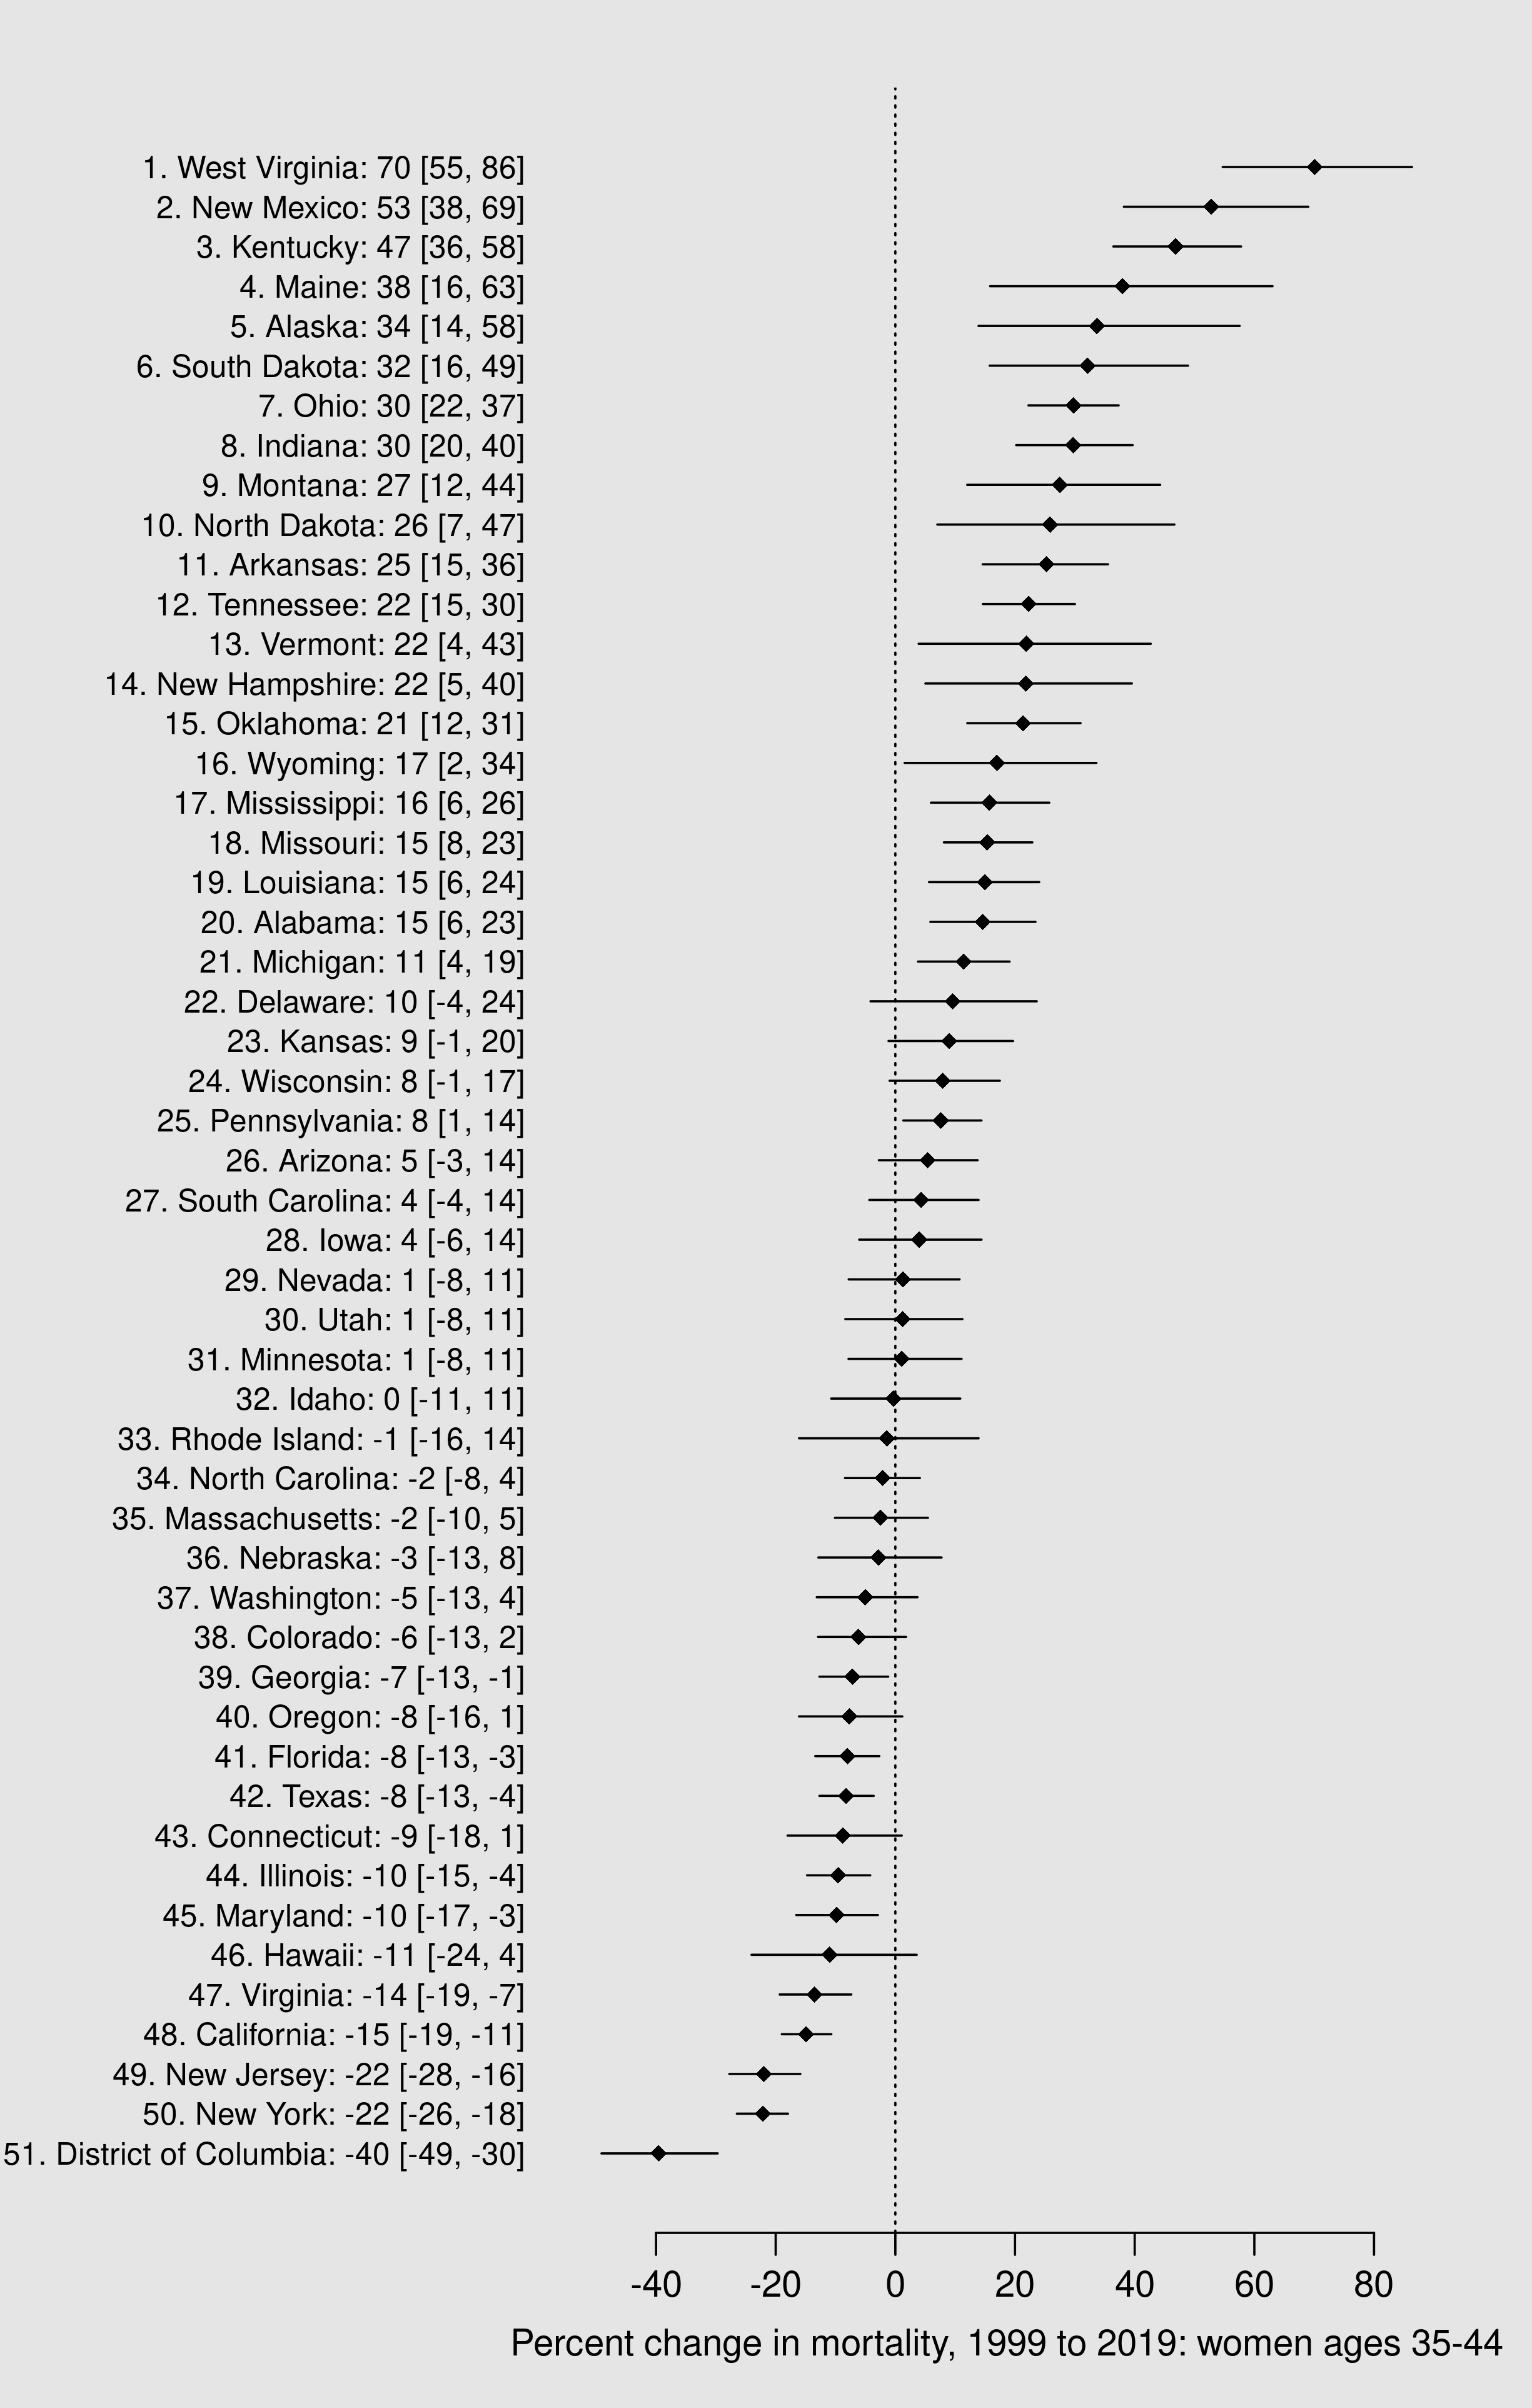
data block, start by introducing a binary indicator fixed_ar, which takes a value of either 0 or 1. Do the same with fixed_tau.
  int<lower=0,upper=1> fixed_ar;
int<lower=0,upper=1> fixed_tau;fixed_ar indicator as a 'switch' when declaring the parameter beta_ar. If we declare beta_ar to be a vector, we can use the switch to decide if it should be length 1 or length TT:
vector<lower=-1, upper=1>[fixed_ar ? 1 : TT-1] beta_ar;tau as a vector:
vector<lower=0>[fixed_tau ? 1 : TT] tau;model block, using the contitional statement to determine the right option 'on the fly':
  for (tt in 1:TT) {
    if (tt == 1) {
     phi_mu[1] = rep_vector(alpha, S);
    } else {
     phi_mu[tt] = beta_ar[fixed_ar ? 1 : tt-1] * phi[tt-1];
    }
    target += normal_lpdf(phi[tt] | phi_mu[tt], tau[fixed_tau ? 1 : tt]);
}# for the standard AR-only model
stan_dl$fixed_tau = 1
stan_dl$fixed_ar = 1
# for time-varying AR-only model
stan_dl$fixed_tau = 0
stan_dl$fixed_ar = 0keep_log_lik. With large N, storing samples of log_lik can reduce computational efficiency, due to memory overload. In that case, you can use this flag to drop those samples unless or until you need to use them.
The 'AR only' Stan model with time-varying parameters
data {
  int S; // sites
  int TT; // time periods
  array [TT, S] int y; // outcome
  array[TT] vector[S] log_pop;   // offset

  int<lower=0,upper=1> keep_log_lik;
  int<lower=0,upper=1> fixed_tau;
  int<lower=0,upper=1> fixed_ar;

  // CAR parts
  int nA_w;
  vector[nA_w] A_w;
  int A_v[nA_w];
  int A_u[S + 1];
  vector[S] Delta_inv;
  real log_det_Delta_inv;
  vector[S] lambda;
}

parameters {
  real alpha;
  array[TT] vector[S] phi;
  vector<lower=0>[fixed_tau ? 1 : TT] tau;
  vector<lower=-1, upper=1>[fixed_ar ? 1 : TT-1] beta_ar;
}

model {
  vector[S] phi_mu;

  for (tt in 1:TT) {
    if (tt == 1) {
       phi_mu = rep_vector(alpha, S);
     } else {
       phi_mu = beta_ar[fixed_ar ? 1 : tt-1] * phi[tt-1];
     }
    target += normal_lpdf(phi[tt] | phi_mu, tau[fixed_tau ? 1 : tt]);

    target += poisson_log_lpmf(y[tt] | log_pop[tt] + phi[tt]);
      }

  target += normal_lpdf(alpha | -4, 4);
  target += uniform_lpdf(beta_ar | -1, 1);
  target += std_normal_lpdf(tau);
}

generated quantities {
  array[TT] vector[keep_log_lik ? S : 0] log_lik;
  if (keep_log_lik) {
    for (tt in 1:TT) {
      for (s in 1:S) log_lik[tt, s] = poisson_log_lpmf(y[tt, s] | log_pop[tt, s] + phi[tt, s]);
    }
  }
}
The 'CARs only' Stan model with time-varying parameters
functions {
#include car_lpdf.stan
}

data {
  int S; // sites
  int TT; // time periods
  array [TT, S] int y; // outcome variable
  array[TT] vector[S] log_pop;   // offset

  // indicators
  int<lower=0,upper=1> keep_log_lik;
  int<lower=0,upper=1> fixed_alpha;
  int<lower=0,upper=1> fixed_rho;
  int<lower=0,upper=1> fixed_tau;

  // CAR parts
  int nA_w;
  vector[nA_w] A_w;
  int A_v[nA_w];
  int A_u[S + 1];
  vector[S] Delta_inv;
  real log_det_Delta_inv;
  vector[S] lambda;
}

parameters {
  array[TT] vector[S] phi;
  vector[fixed_alpha ? 1 : TT] alpha;
  vector<lower=0>[fixed_tau ? 1 : TT] tau;
  vector<lower=1/min(lambda), upper=1/max(lambda)>[fixed_rho ? 1 : TT] rho;
}

model {
  vector[S] phi_mu;

  for (tt in 1:TT) {
    phi_mu = rep_vector(alpha[fixed_alpha ? 1 : tt], S);
    target += wcar_normal_lpdf(
			       phi[tt] |
			       phi_mu,
			       tau[ fixed_tau ? 1 : tt ],
			       rho[ fixed_rho ? 1 : tt ],
			       A_w, A_v, A_u,
			       Delta_inv,
			       log_det_Delta_inv,
			       lambda,
			       S);
    y[tt] ~ poisson_log(log_pop[tt] + phi[tt]);
  }

  target += normal_lpdf(alpha | -4, 4);
  target += std_normal_lpdf(tau);
}

generated quantities {
  array[TT] vector[keep_log_lik ? S : 0] log_lik;
  if (keep_log_lik) {
    for (tt in 1:TT) {
      for (s in 1:S) log_lik[tt, s] = poisson_log_lpmf(y[tt, s] | log_pop[tt, s] + phi[tt, s]);
    }
  }
}
The full CAR-AR model with options
functions {
#include car_lpdf.stan
}

data {
  int S; // sites
  int TT; // time periods
  array [TT, S] int y; // outcome
  array[TT] vector[S] log_pop;   // offset

  int<lower=0,upper=1> keep_log_lik;
  int<lower=0,upper=1> fixed_rho;
  int<lower=0,upper=1> fixed_tau;
  int<lower=0,upper=1> fixed_ar;

  // CAR parts
  int nA_w;
  vector[nA_w] A_w;
  int A_v[nA_w];
  int A_u[S + 1];
  vector[S] Delta_inv;
  real log_det_Delta_inv;
  vector[S] lambda;
}

parameters {
  array[TT] vector[S] phi;
  real alpha;
  vector<lower=0>[fixed_tau ? 1 : TT] tau;
  vector<lower=-1, upper=1>[fixed_ar ? 1 : TT-1] beta_ar;
  vector<lower=1/min(lambda), upper=1/max(lambda)>[fixed_rho ? 1 : TT] rho;
}

model {
  array[TT] vector[S] phi_mu;

  for (tt in 1:TT) {
      if (tt == 1) {
       phi_mu[1] = rep_vector(alpha, S);
      } else {
       phi_mu[tt] = beta_ar[fixed_ar ? 1 : tt-1] * phi[tt-1];
      }

      target += wcar_normal_lpdf(
				 phi[tt] |
				 phi_mu[tt],
				 tau[fixed_tau ? 1 : tt],
				 rho[fixed_rho ? 1 : tt],
				 A_w, A_v, A_u,
				 Delta_inv,
				 log_det_Delta_inv,
				 lambda,
				 S);

      target += poisson_log_lpmf(y[tt] | log_pop[tt] + phi[tt]);
      }

  target += normal_lpdf(alpha | -4, 4);
  target += uniform_lpdf(beta_ar | -1, 1);
  target += std_normal_lpdf(tau);
}

generated quantities {
  array[TT] vector[keep_log_lik ? S : 0] log_lik;
  if (keep_log_lik) {
    for (tt in 1:TT) {
      for (s in 1:S) log_lik[tt, s] = poisson_log_lpmf(y[tt, s] | log_pop[tt, s] + phi[tt, s]);
    }
  }
}To clarify, view our first CAR model like this: \begin{aligned} &y_i \sim Poisson(p_i \cdot exp(\phi_i)) \\ &\phi \sim Normal(\mu, \Sigma(\rho, \tau)) \end{aligned} where the CAR covariance matrix is specified in the usual way, with a spatial dependence parameter and a scale parameter (now made explicit in the notation). To fit a spatial auto-regressive model to sparse data, we can encode the same model in a slightly different way: \begin{aligned} &y_i \sim Poisson(p_i \cdot exp(\phi_i)) \\ &\phi = \mu + \tilde{\phi} \cdot \tau \\ &\tilde{\phi} \sim Normal(0, \Sigma(\rho, 1)), \end{aligned} where \( \tilde{\phi} \) has mean of zero and scale of 1. The latter method is known generally as the 'non-centered parameterization'.
This works well for sparse spatial data (it is implemented in geostan as the 'zero-mean parameterization' or zmp). For space-time modeling, this approach seems to require adjustment. It does not sample adequately.In my experience, it samples much better in the CAR-AR model if we do not force the CAR model to have a mean of zero, but we do keep the scale parameter fixed at one. This is the parameterization that we want to use for sparse space-time data: \begin{aligned} &\phi = \tilde{\phi} \cdot \tau \\ &\tilde{\phi} \sim Normal(\mu, \Sigma(\rho, 1)) \end{aligned} where \( \mu \) may contains the AR model.
An important note: neither the standard ('centered') nor the adjusted, 'sparse-data' parameterization will work well in all situations. If you apply the latter parameterization to non-sparse data (like our state mortality rates) it will probably sample poorly. If one doesn't seem to work well, try the other. ### Stan code for the sparse-data fix We can use the 'sparse-data' CAR model without making any other changes to our workflow.
For the CAR-AR model, our parameters block needs to include \( \tilde{\phi} \) as phi_tilde (replacing phi):
array[TT] vector[S] phi_tilde;model block needs to be adjusted, as:
  for (tt in 1:TT) {
     if (tt == 1) {
      	phi_tilde_mu[1] = rep_vector(alpha, S);
      } else {
      	phi_tilde_mu[tt] = beta_ar * phi_tilde[tt-1];
      }

      // CAR with tau=1
       target += wcar_normal_lpdf(
         phi_tilde[tt] |
         phi_tilde_mu[tt],
	 1, // tau=1
	 rho,
	 A_w, A_v, A_u,
	 Delta_inv,
	 log_det_Delta_inv,
	 lambda,
	 S);

    // Now, put phi onto its proper scale: multiply phi_tilde by tau
    target += poisson_log_lpmf(y[tt] | log_pop[tt] + phi_tilde[tt] * tau);
}phi):
generated quantities {
  array[TT] vector[S] phi;
  array[TT] vector[S] log_lik;
  for (tt in 1:TT) {
    phi[tt] = phi_tilde[tt] * tau;
    for (i in 1:S) log_lik[tt, i] = poisson_log_lpmf(y[tt, i] | log_pop[tt, i] + phi[tt, i]);
  }
}stan_dl.
Below, I provide full Stan code for this model but also apply the technique to each of our model types.
The complete Stan model with sparse-data parameterization
When using this Stan model, you have to specify which model type you want to use. In R:# for CAR-AR
stan_dl$type <- 3/*
Type 0: Partial pooling using iid normal distribution.
Type 1: AR only, giving one time trend per areal unit.
Type 2: CAR only, one spatial trend for each time period
Type 3: CAR-AR, one time trend per areal unit with CAR model for the cross-sectional errors
*/
functions {
#include car_lpdf.stan
}
data {
int S; // sites
int TT; // time periods
array [TT, S] int y; // stacked observations over time
array[TT] vector[S] log_pop;
int<lower=0,upper=3> type;
// CAR parts
int nA_w;
vector[nA_w] A_w;
int A_v[nA_w];
int A_u[S + 1];
vector[S] Delta_inv;
real log_det_Delta_inv;
vector[S] lambda;
}
parameters {
real alpha;
real<lower=0> tau;
real<lower=-1,upper=1> beta_ar;
real<lower=1/min(lambda), upper=1/max(lambda)> rho;
array[TT] vector[S] phi_tilde; // de-scaled phi
}
model {
array[TT] vector[S] phi_tilde_mu;
for (tt in 1:TT) {
if (type == 0) {
target += std_normal_lpdf(phi_tilde[tt] - alpha);
}
if (type == 1) {
if (tt == 1) {
phi_tilde_mu[1] = rep_vector(alpha, S);
} else {
phi_tilde_mu[tt] = beta_ar * phi_tilde[tt-1];
}
target += std_normal_lpdf(phi_tilde[tt] - phi_tilde_mu[tt]);
}
if (type == 2) {
phi_tilde_mu[tt] = rep_vector(alpha, S);
// CAR with tau=1
target += wcar_normal_lpdf(
phi_tilde[tt] |
phi_tilde_mu[tt],
1, // tau=1
rho,
A_w, A_v, A_u,
Delta_inv,
log_det_Delta_inv,
lambda,
S);
}
if (type == 3) {
if (tt == 1) {
phi_tilde_mu[1] = rep_vector(alpha, S);
} else {
phi_tilde_mu[tt] = beta_ar * phi_tilde[tt-1];
}
// CAR with tau=1
target += wcar_normal_lpdf(
phi_tilde[tt] |
phi_tilde_mu[tt],
1, // tau=1
rho, //
A_w, A_v, A_u,
Delta_inv,
log_det_Delta_inv,
lambda,
S);
}
// Now, put phi onto its proper scale: multiply phi_tilde by tau
target += poisson_log_lpmf(y[tt] | log_pop[tt] + phi_tilde[tt] * tau);
}
target += normal_lpdf(alpha | 0, 2);
target += uniform_lpdf(beta_ar | -1, 1);
target += std_normal_lpdf(tau);
}
generated quantities {
array[TT] vector[S] phi;
array[TT] vector[S] log_lik;
for (tt in 1:TT) {
phi[tt] = phi_tilde[tt] * tau;
for (i in 1:S) log_lik[tt, i] = poisson_log_lpmf(y[tt, i] | log_pop[tt, i] + phi[tt, i]);
}
}